Weekly Price Action Trade Ideas – 7th to 11th Oct 2019
Markets Discussed in This Week’s Trade Ideas: USDJPY, GBPUSD, AUDUSD and SILVER.
Note: We Use Correct ‘New York Close 5 Day Charts’ – You can read about why we use these and how to download the correct free charts at Correct Free New York Close Demo Charts
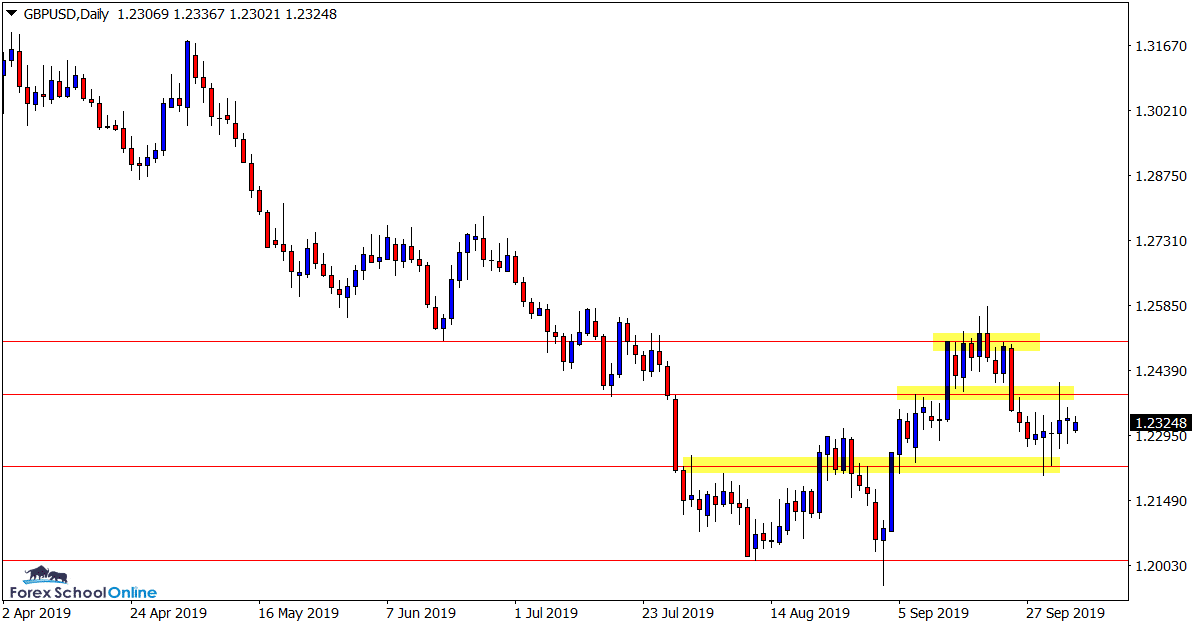
GBPUSD Daily Chart
Inside Bars in Sideways Move
In the last four completed daily candles price on the GBPUSD has formed two inside bars. This shows just how indecisive this market is at the moment.
A major reason for this lack of control from either the bulls or bears is because of where price is currently trading.
As the daily chart shows below; price has recently rejected a pretty important price flip resistance level. Just below this resistance level and also where price currently sits is also a near term support level.
Until this market breaks one of these levels it makes it a tricky market to play because of how close both of these levels are and the lack of control from either side.
Daily Chart

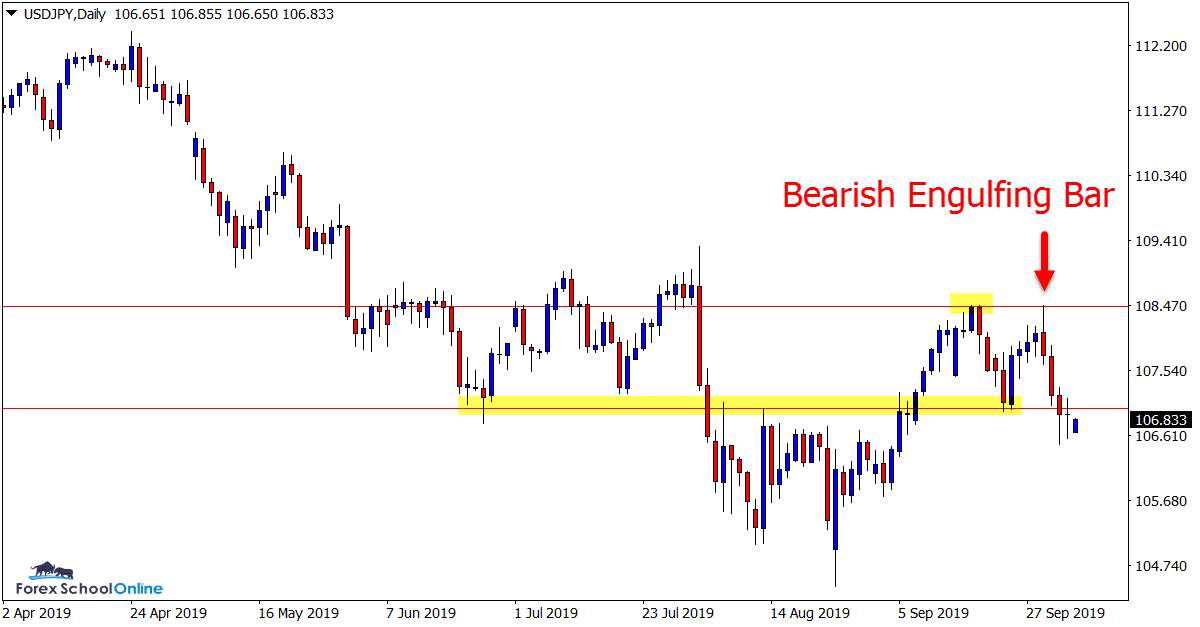
USDJPY Daily Chart
Engulfing Bar Sends Price Lower
In last week’s trade ideas we were looking to see which way price would pop after forming a pair of 2 bar reversals.
With price stuck between two crucial swing points, price rotated higher and formed a bearish engulfing bar that sent price crashing back lower. This was the same resistance level that price had also formed the recent bearish 2 bar reversal.
On the daily chart we can see that there is a bunch of support levels below and price has formed an inside bar showing signs of indecision.
Daily Chart

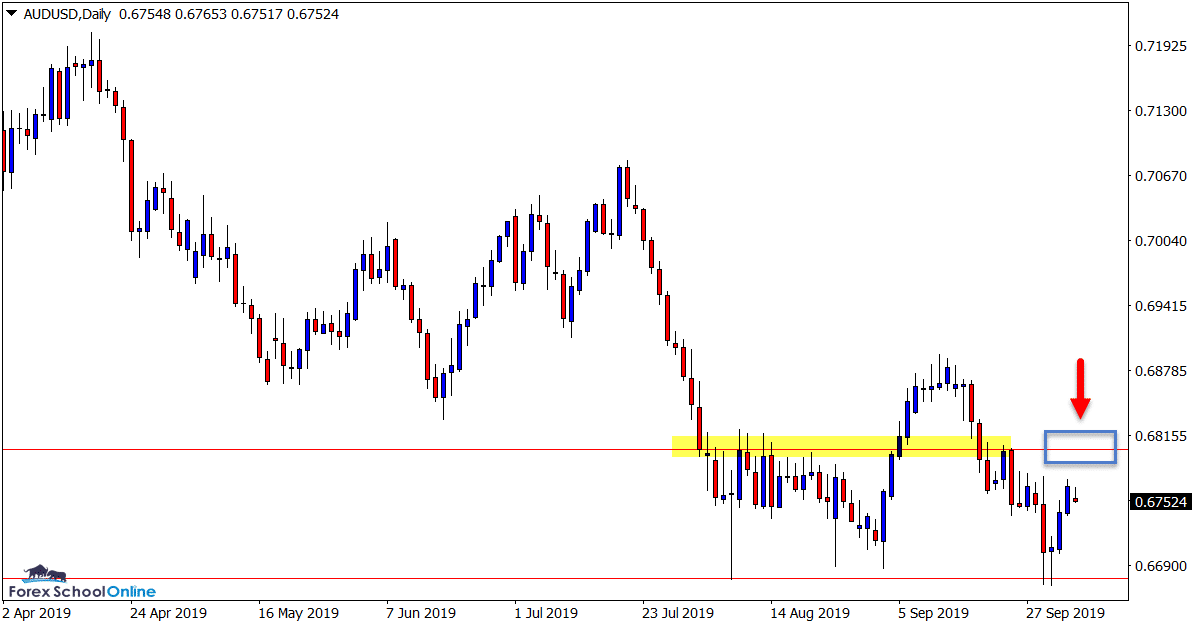
AUDUSD Daily Chart
Moving Into Box Resistance
Price on the AUDUSD has recently been trading down at levels not seen in ten years.
Whilst this market has seen a steady sell off lower in recent times, in the short-term price has been holding at the extreme support level.
The momentum in this market still looks to be lower and if the major resistance overhead holds, then it could be a solid level to hunt A+ trade signals.
Daily Chart

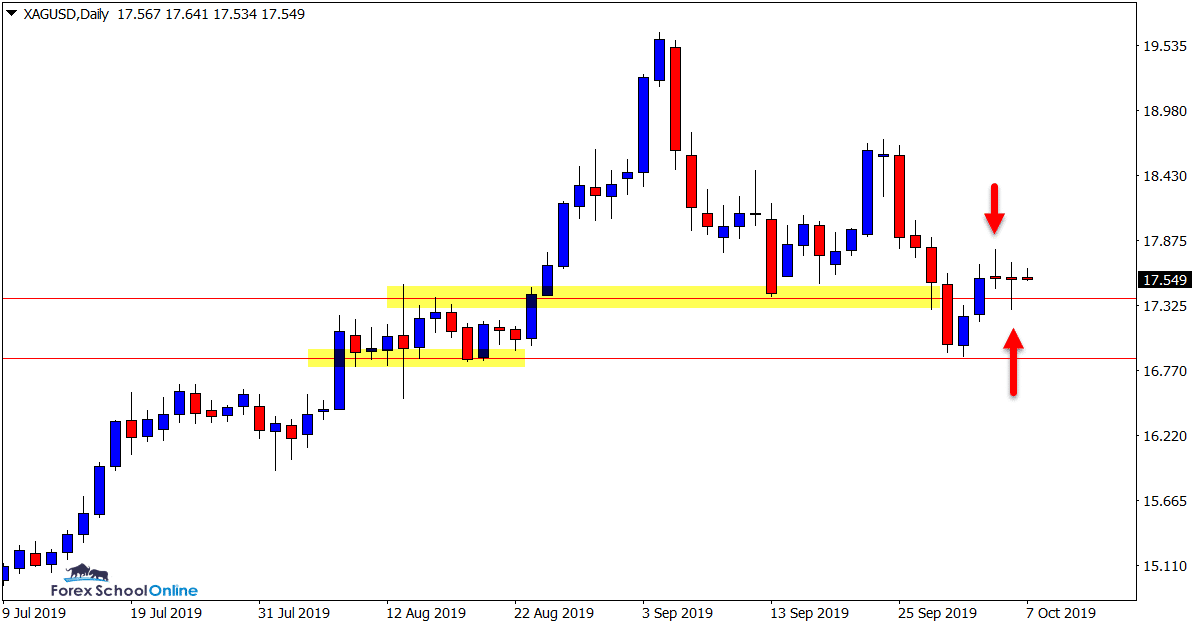
SILVER Daily Chart
Dueling Pin Bars
This is a market we have been watching closely of late. In last week’s trade ideas we discussed the weekly chart pin bars and engulfing bars.
After breaking the low of the bearish engulfing bar, price quickly raced lower and moved directly into the near term support level.
Since the support level held we have seen some mixed price action. On the daily chart we now have dueling pin bars; a bearish pin bar, followed by a bullish pin bar.
The interesting thing about these pin bars is that they are on top of the recent price flip support level. This level looks crucial and if we can see this level continue to hold, bullish traders could once again start hunting long trades and for price to move into the recent swing high.
Daily Chart

Trade Ideas Note: All views, discussions and posts in the ‘charts in focus trade ideas’ are the view of Forex School Online and are not recommendations or trading advice. All posts are general in nature and are not advice to buy or sell.
Please leave questions or comments in the comments section below;


Leave a Reply