How to Trade the Pennant, Triangle, Wedge, and Flag Chart Patterns
Whilst using one and two candlestick patterns such as the pin bar reversal are extremely popular for finding trade setups, they are only as good as the area that the trade is being taken from.
If a pin bar is being played from a poor area, then the chances of making a winning trade are low.
To increase the chances of making a winning trade you can use many price action clues to see what the markets could be looking to do. These include the recent trend, the major support and resistance levels and other patterns price is forming.
In today’s lesson we discuss the pennant, triangle, wedge, and flag chart patterns, but there are many others you can also use and you will find lessons for on this site. These include market reversals, 123 pattern, double tops and double bottoms and swing highs and lows to find high probability trades.
There are two major types of chart patterns that we are going to look at and discuss in today’s lesson;
#1: Reversal Patterns
A reversal pattern occurs when price ‘reverses’ its current direction. An example of a reversal trade setup often used with candlesticks is the pin bar or engulfing bar.
With these candlestick patterns price will move higher or lower before forming the reversal candlestick and moving back in the opposite direction.
#2: Continuation Patterns
Continuation patterns can be a breakout trade where price breaks from a pause or consolidation, or a continuation after a short pause in a move higher or lower.
A simple continuation candlestick pattern that is often used is the inside bar. This is where price makes a move, pauses and forms the inside bar, and then continues in the same direction.
The chart patterns discussed in this lesson are not just one or two candlestick patterns, but are formed by the recent price action history to show a potential market reversal or continuation breakout trade.
Triangle Pattern Forex
The triangle is a continuation pattern.
There are three different triangle patterns that are each discussed below; ascending triangle, descending triangle and symmetrical triangle.
Symmetrical Triangle
The symmetrical triangle pattern is a classic sideways pattern where the market is consolidating.
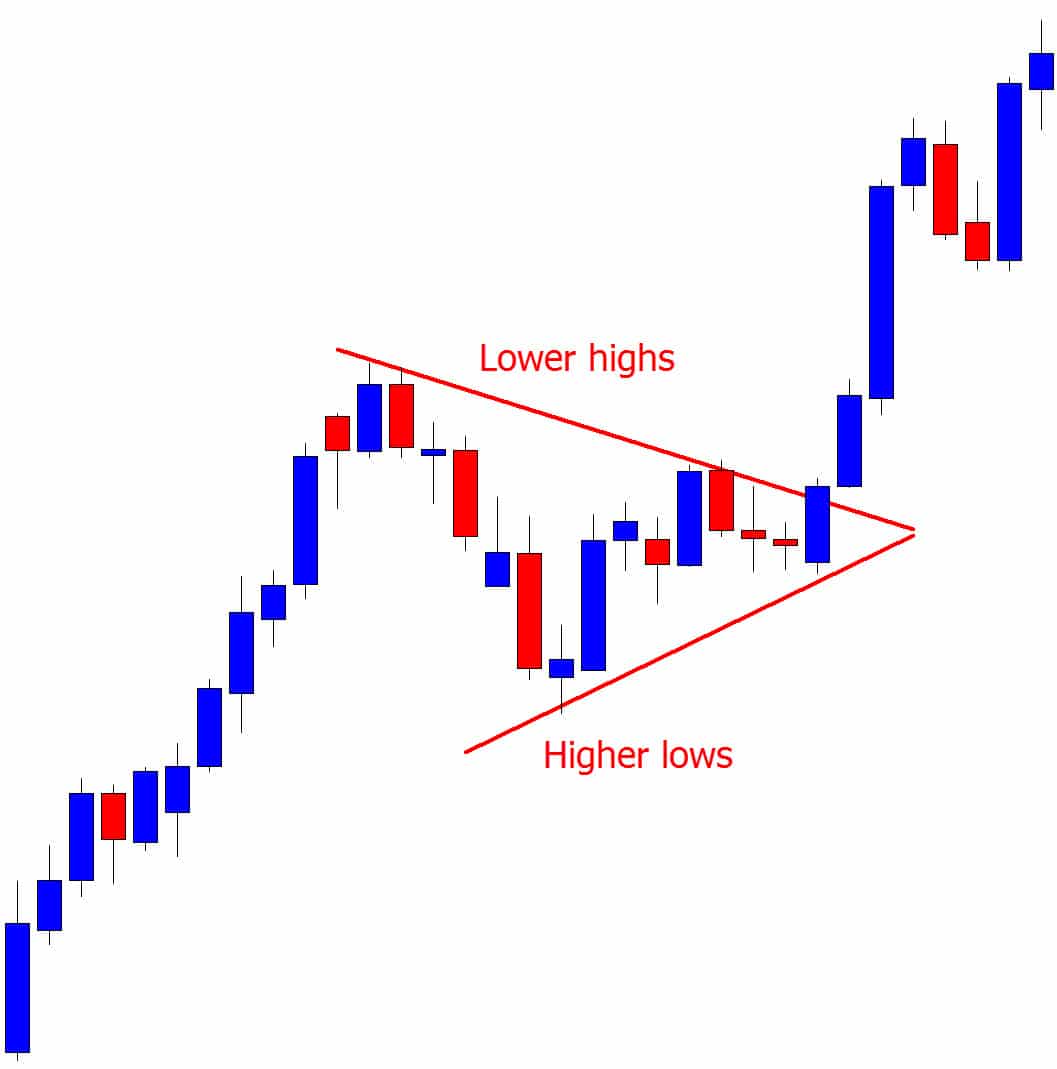
When this pattern is forming it creates lower highs and higher lows that look like a squeeze and price action tightening. This also shows that neither the bulls or bears have any control over the current movement.
As with all continuation patterns, price will most often look to continue with the same move it was in before it moved into the consolidation phase. In other words; if price was trending higher before moving into consolidation, it will often break higher in the same direction completing the continuation.
This is also a high probability way to look at the symmetrical triangle for potential trade setups. You could look to make trades when price breaks out of the wind up phase, or look for quick break and intraday retest trades.
Ascending Triangle Chart Pattern
The ascending triangle pattern is formed when there is a clear resistance level and price begins making a series of higher lows to form the triangle.
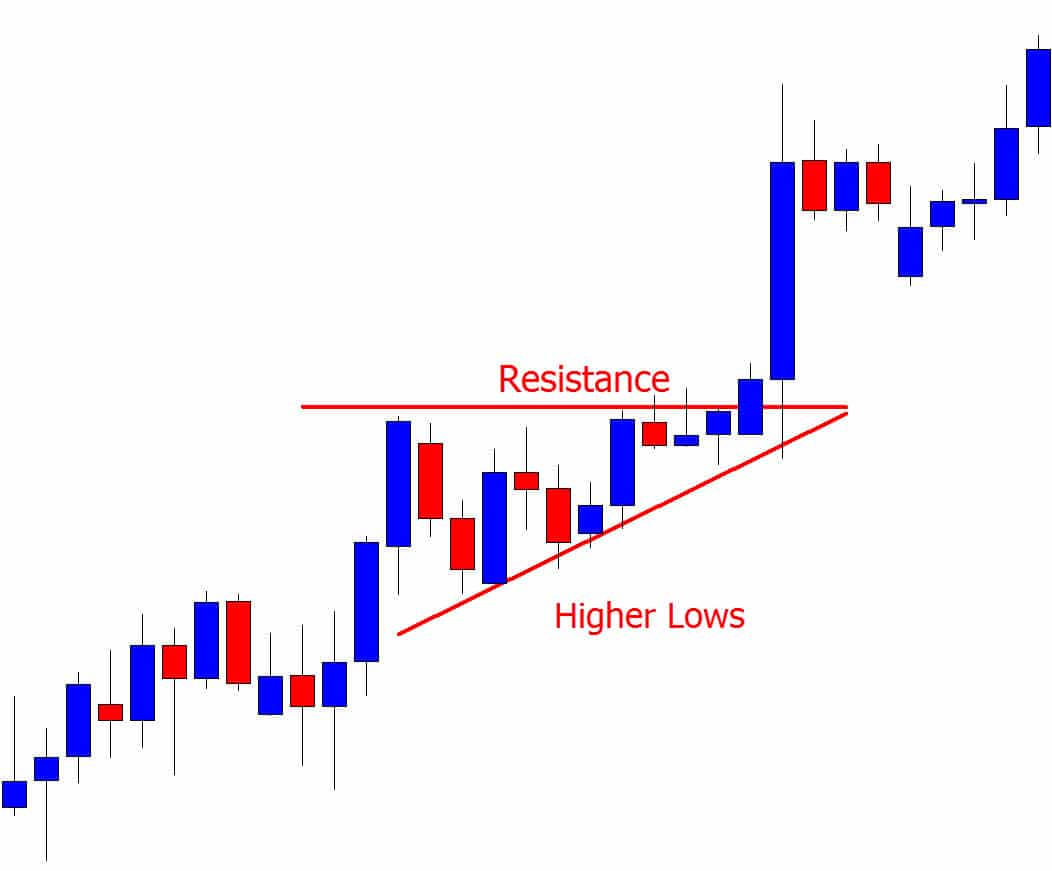
Whilst there is a clear resistance in place that buyers are unable yet to break through, the selling by the bears from the resistance is becoming weaker and weaker each time. This creates the higher lows and indicates the bulls may be finally ready to take control and break-through.
You will often find this pattern in a trend higher where price pauses and begins to accumulate. Price is pausing, gathering more buyers and looking to then potentially continue the trend higher.
Descending Triangle Chart Pattern
The descending triangle is the same formation as the ascending triangle, but inverse.
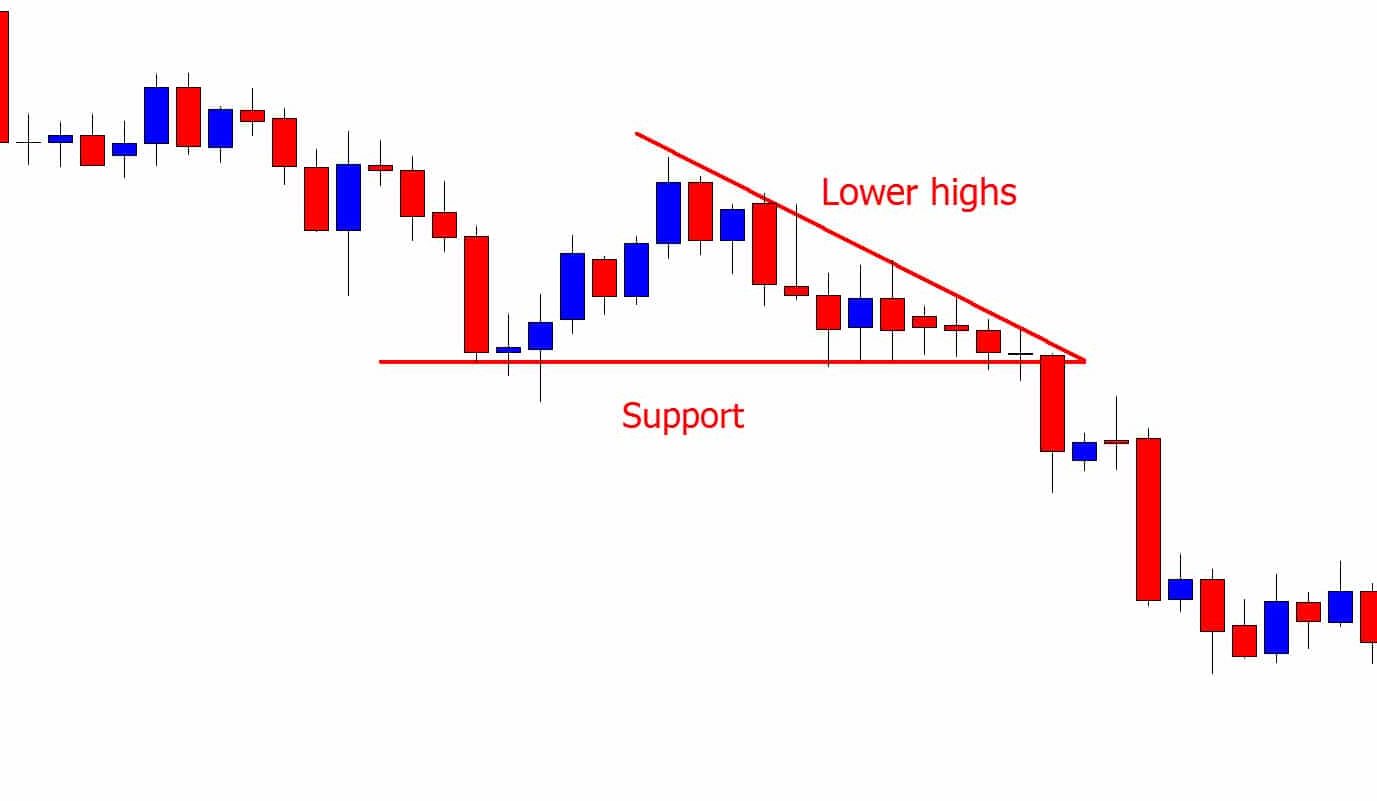
The descending triangle chart pattern can be a bearish continuation pattern that will normally form in a downtrend.
To identify this pattern you will need to spot a clear support level followed by a series of lower highs. This shows that whilst there is a clear support price is being held at thus far, each time buyers attempt to push price back higher the rejection is getting weaker and weaker.
Pennant Chart Pattern
A pennant chart pattern is a continuation pattern.
This pattern is created when price makes a large move either higher or lower and then begins to move sideways and consolidate. During this sideways movement price begins to squeeze with converging trend lines creating a pennant that will often be form as a triangle.
Bullish Pennant Pattern
Because pennants are continuation patterns, price is looking to move in the same direction that it was trading in before moving into the consolidation period.
In the bullish pennant example below you can see that price made a sharp move higher, followed by the ‘pennant’ and then the continuation breakout inline with the first move higher.
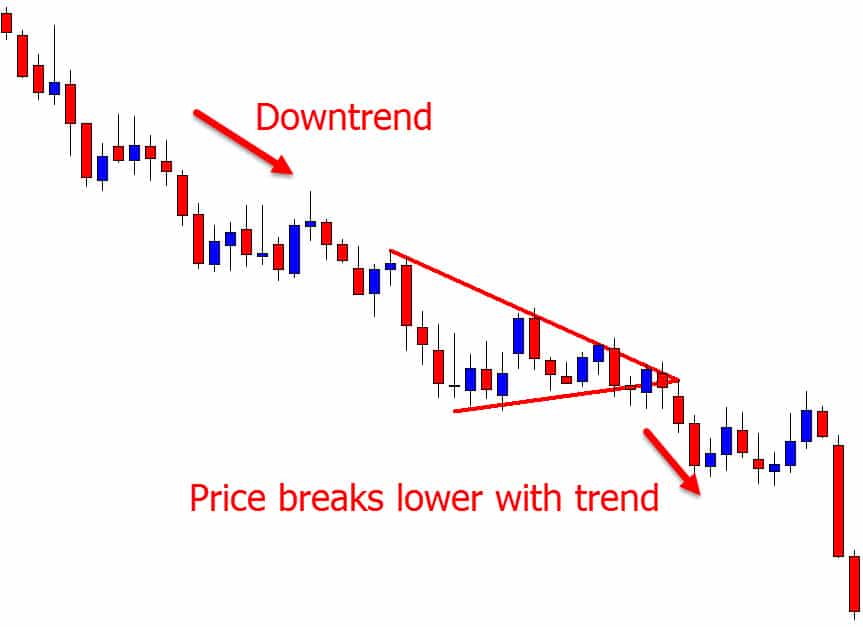
Bearish Pennant Pattern
A bearish pennant is the same pattern as a bullish pennant, but inverse.
In the example below you can see price was making a solid move lower. It then began a consolidation phase and formed the ‘pennant’, followed by the breakout and continuation lower.
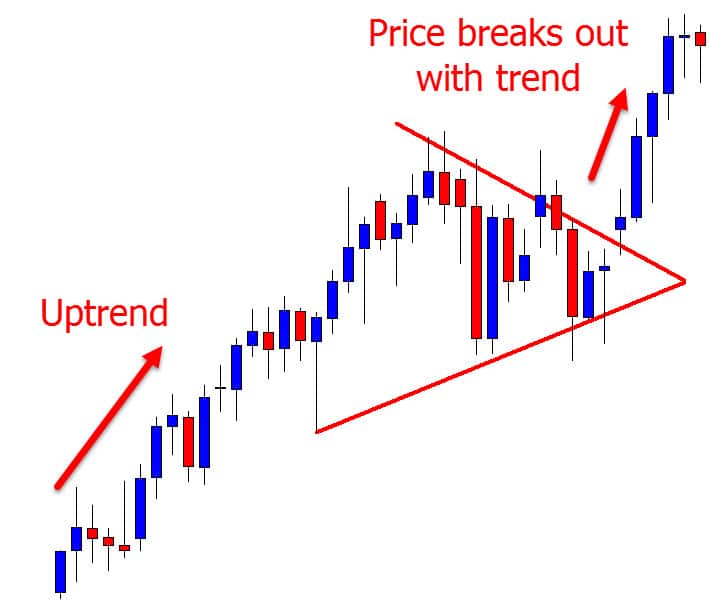
Trading a Pennant Breakout
The simplest way to trade pennants is using them to find breakout trade setups inline with the trend.
This can be done in two ways. If you are an aggressive trader you can take an entry when price breaks either the high or low of the pennant and look for price to continue.
If you are more conservative, you can look for price to breakout and then retest the old trend line high or low and wait for it to act as a new support or resistance level to find a trade.
Wedge Chart Pattern
There are two types of wedge patterns. The rising wedge and falling wedge.
Both wedge patterns are created when price begins forming converging trend lines. The wedge chart pattern can be used for both continuations and reversals depending on the market trend.
Whereas a triangle does not have a bias and is not moving higher or lower, wedge patterns are either sloping higher or lower.
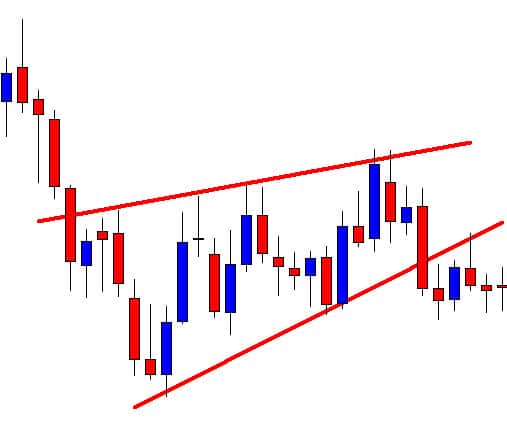
Rising Wedge Pattern
To identify a rising wedge chart pattern you will need to spot price forming upward sloping support and resistance levels.
You will also notice in the example below that the support level is steeper than that of the resistance level creating a ‘wedge’.
Because price is moving sideways it eventually has to breakout. This is where identifying the market trend and the price action before price moved into the wedge is important.
This pattern is normally used as a continuation if it is formed during a downtrend. If however; it is formed during an uptrend, you could watch for a potential reversal and change in the trend direction.
Falling Wedge Pattern
In the example below the falling wedge chart pattern is indicating a continuation.
You will notice that before moving into the wedge, price action had been moving in an uptrend. Price then breaks out higher and continues on with the move.
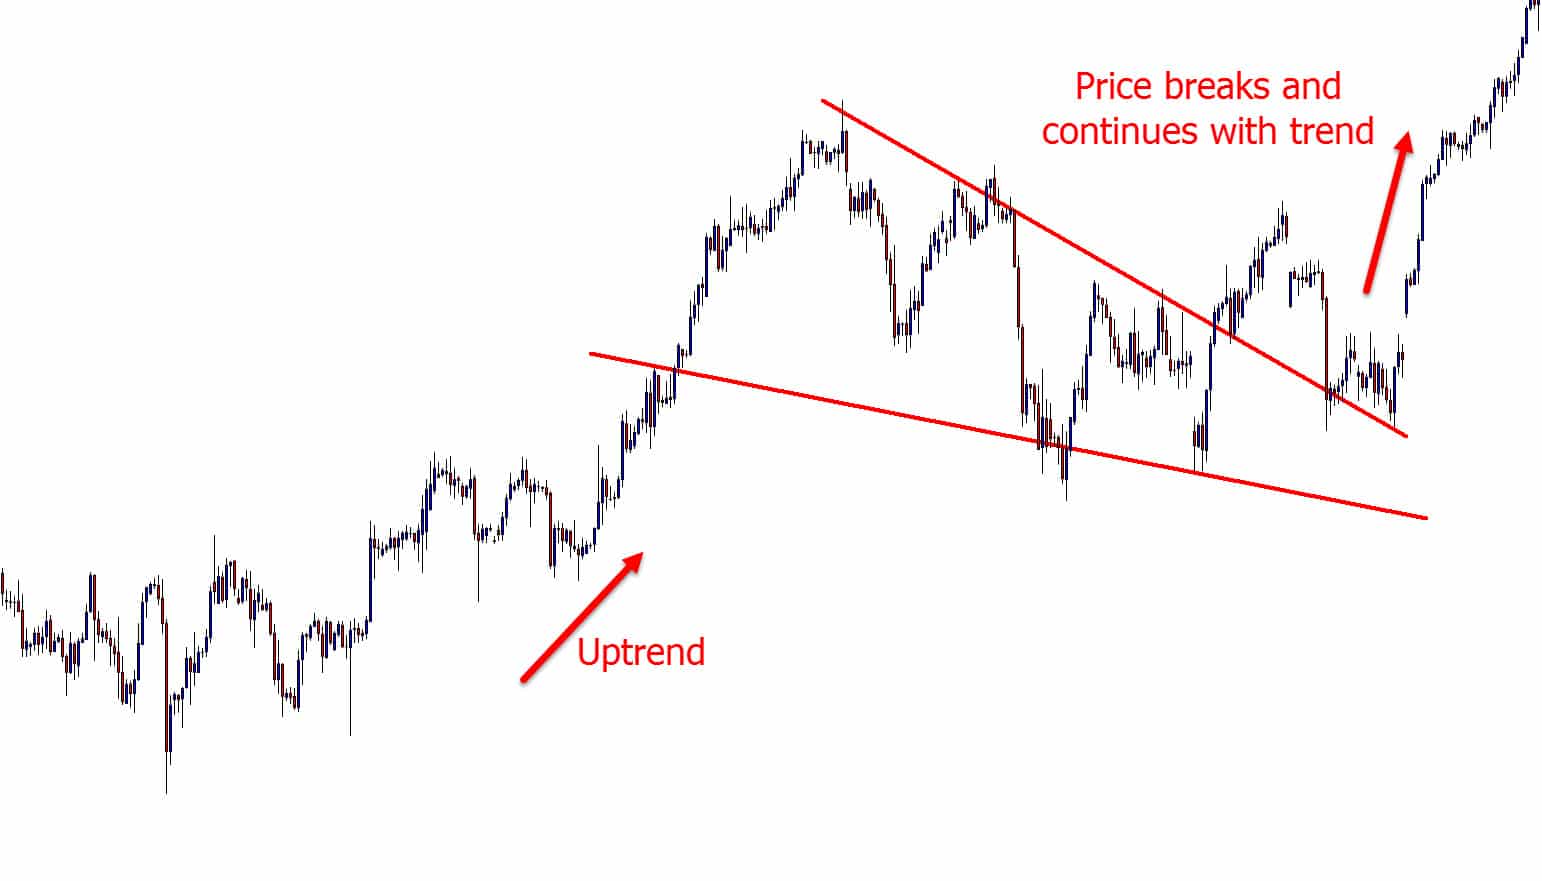
If this pattern was to form at the bottom of a downtrend, then traders could watch for a possible market reversal and change in the trend direction.
Flag Pattern
This is one of the easiest patterns to spot and also one of the most useful in your price action analysis.
Not only will this help you find and manage trades, but also analyze what the market is looking to potentially do next.
The flag pattern is given its name because it looks like a flag with a pole (the move higher or lower) and then the flag (the quick sideways pattern).
These are normally short-term patterns that you will quickly identify as the market looking like it is stepping higher or lower.
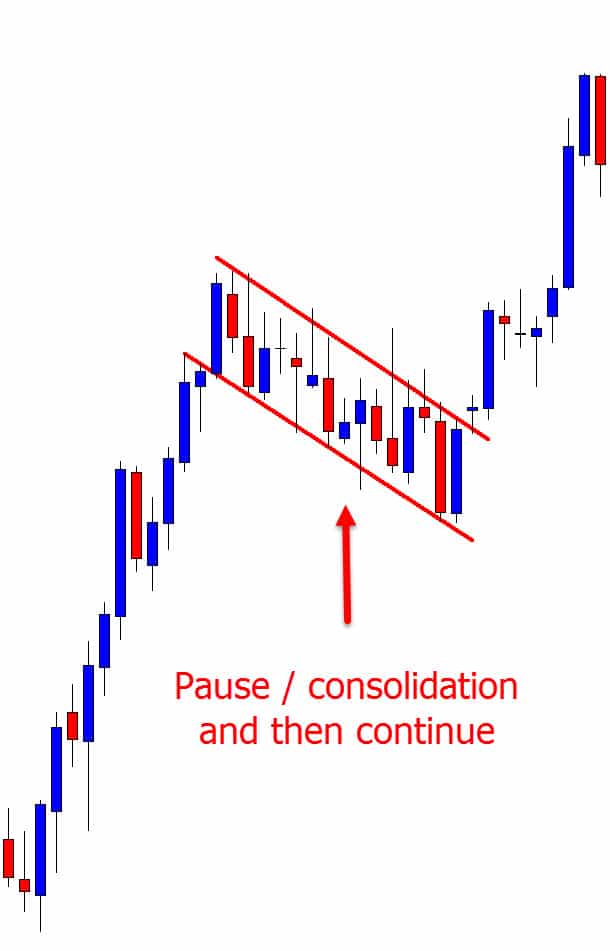
Bullish Flag Pattern Trading
The bullish flag pattern is created when price is in a strong trend higher. Price will make a strong move higher creating the pole and then consolidate sideways creating the flag.
Whilst the sideways consolidation and formation of the flag will often be angled lower for a bullish flag, it can also be directly sideways in a horizontal shape.
The example below shows price creating the pole with the fast rise higher, followed by the bullish flag that is created with price consolidating. Finally, price breaks out higher and continues the trend.
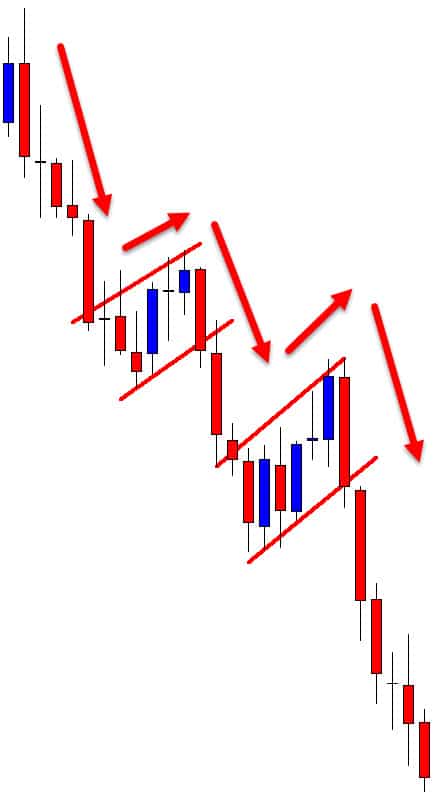
Bearish Flag Pattern Trading
A bearish flag pattern is created with price moving in a downtrend and then pausing sideways to create the ‘flag’.
After a strong move price will often consolidate or rebound in a consolidation pattern slightly higher (if in a downtrend) before then strongly continuing with the trend.
As you can see from the chart example below; price formed a series of bearish flag chart patterns in the strong move lower. Each time this gave traders a chance to either enter new trades or manage their existing ones.
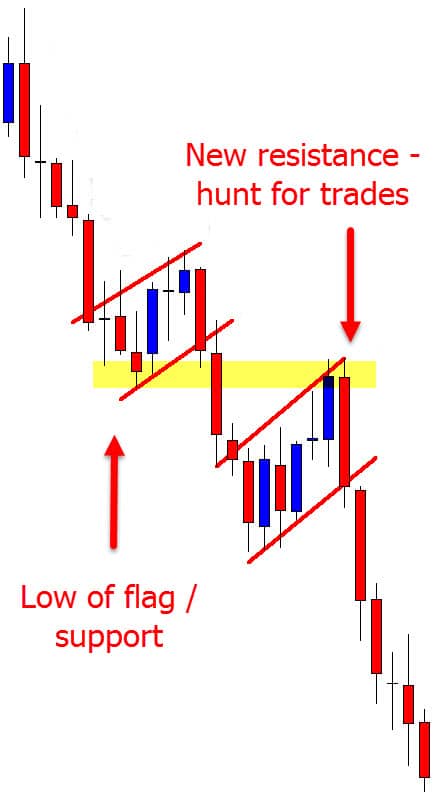
The high probability method to playing flag patterns is to look for breakouts inline with the current strong trend. This could involve either a straight aggressive breakout trade, or looking for price to breakout and then retest the flag high or low. See the example below;
Recap
There are many, many different chart patterns, candlestick patterns and trading strategies.
You don’t need them all. Often trying to use them all will only end in analysis paralysis and being unable to find any trades at all.
Many traders find the best way is to use the strategies that suit them and their style, and then master them.
Safe trading,
Johnathon
Make sure to leave any questions or comments in section below;

Wow this is really helpful and self explanatory
Really your courses are very useful. But Pin bar setups are very effective and profitable.
Thanks Dinesh! Great to have you 👍👍
Johnathon