USDCAD Daily Chart
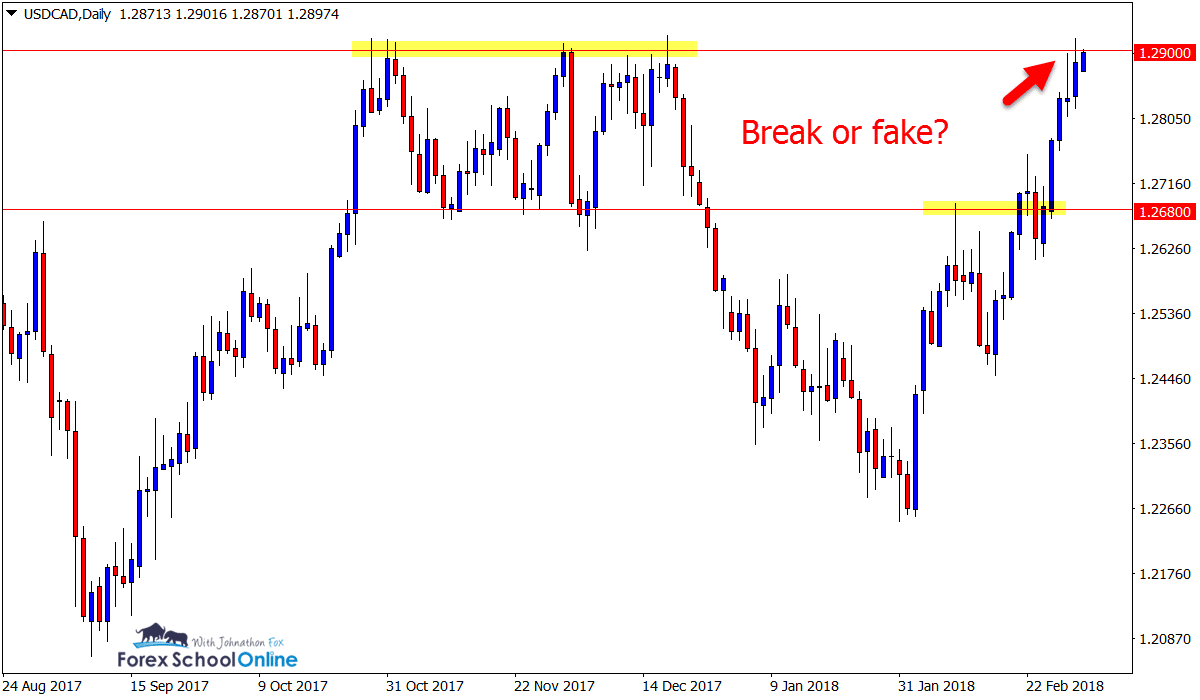
Price on the USDCAD is testing a hugely important daily resistance area and Round Number 1.2900 on the daily price action chart.
After breaking higher and through the 1.2680 price flip level, we have seen price make a swift move into this major area of previous resistance. Whilst we did see a small rejection candle form, price is now making another test at breaking this level.
Any breaks and closes above this level could open the potential for long trade opportunities with quick break and re-tests setups on smaller time frames.
Lesson: High Probability Price Action Strategy Using the First Re-test

CADCHF Daily Chart
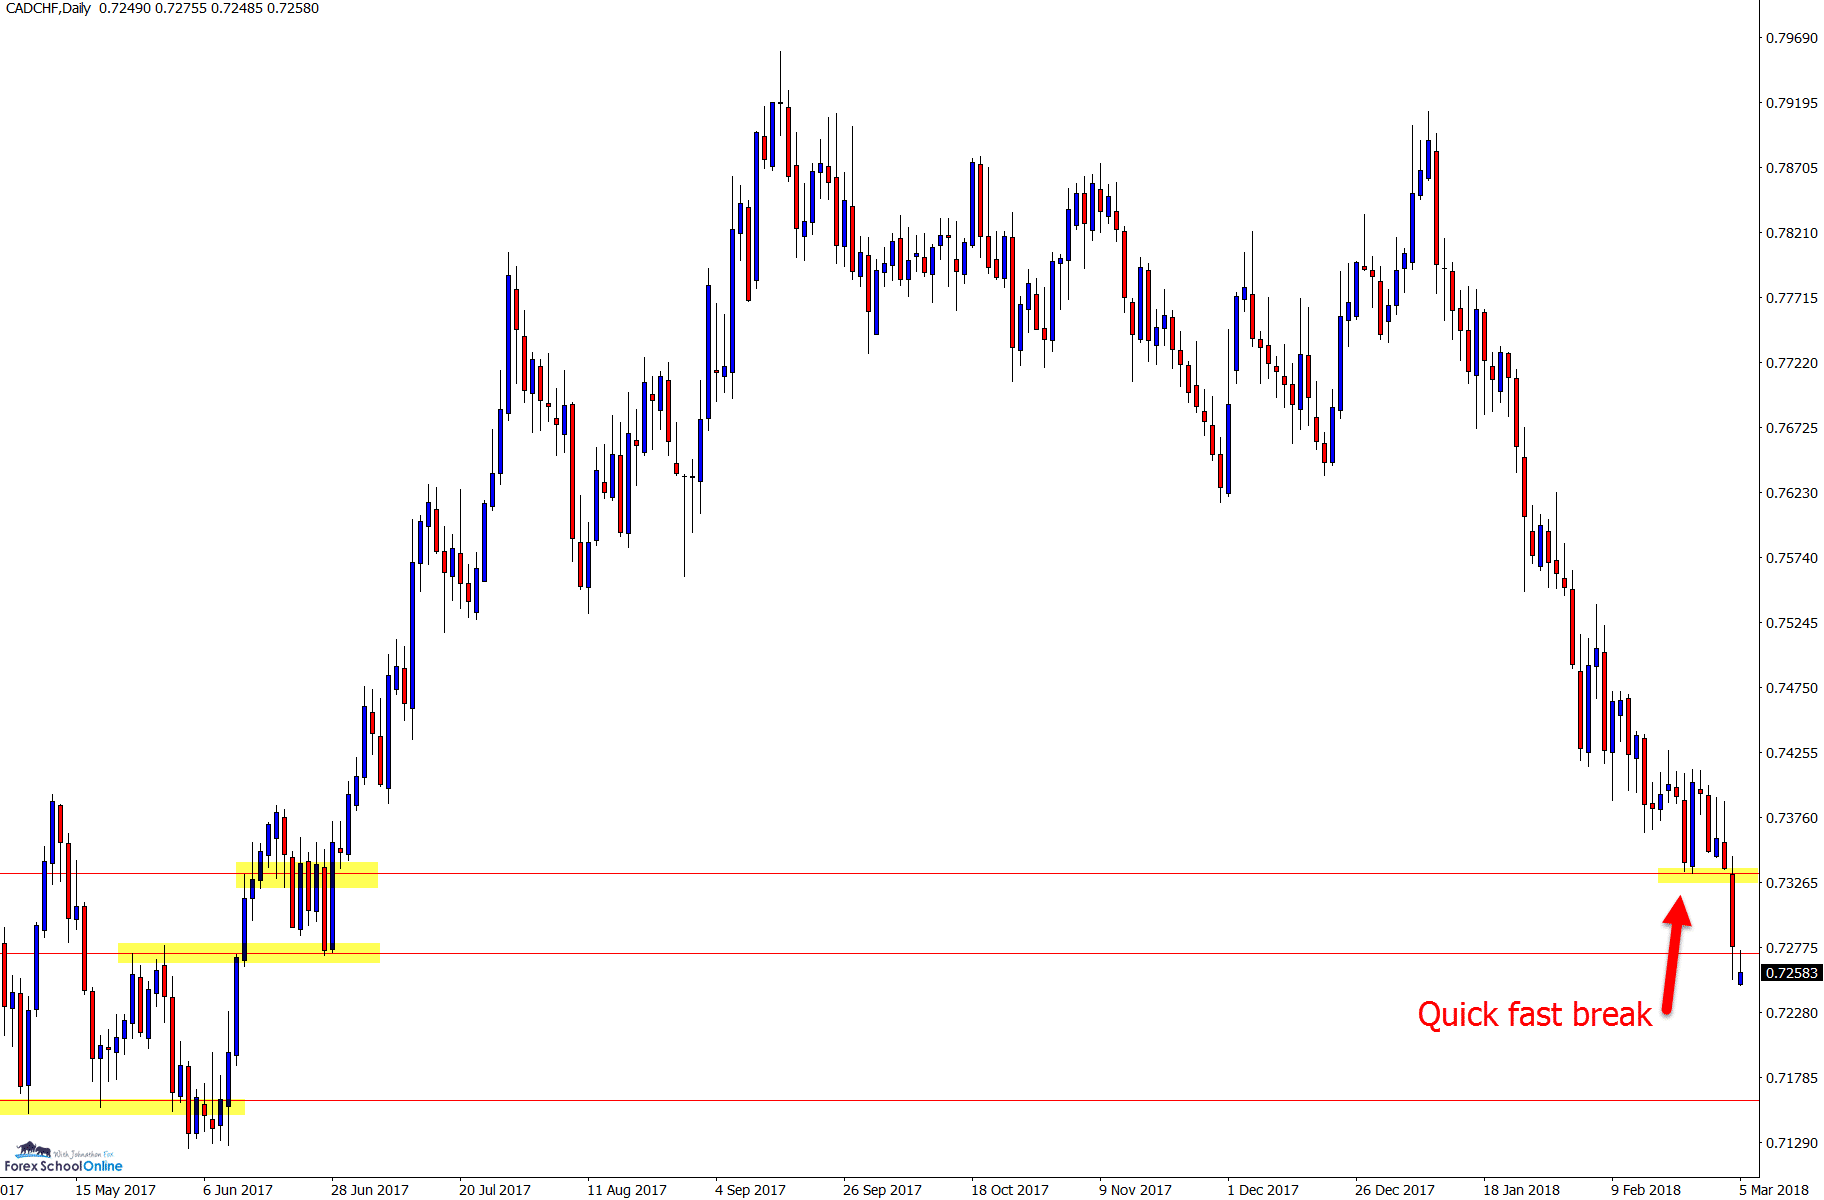
This market has been in free-fall of late and once again at the start of today’s trading price has opened lower.
There are two major levels in this market and the chart below shows already at the start of the trading week that price is retracing higher to test the overhead price flip and resistance.
Price broke out and smashed through the major support level with fury last week and if the momentum continues lower there is more room to continue falling.

US Tech Daily Chart
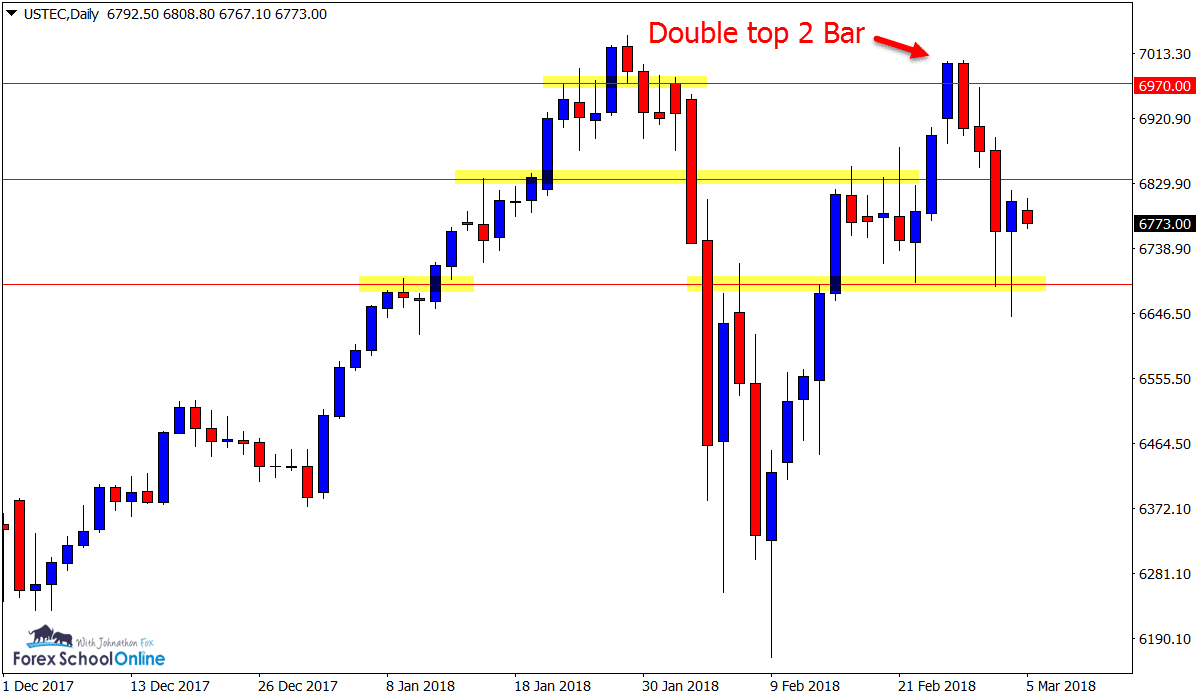
After price made those large losses in a lot of the major stock indices around the world as we discussed in the Charts in Focus blog, price pulled back and recovered a lot of it’s losses.
Last week we saw price move higher and within reach of recent highs in a lot of these markets and form clear bearish clues, like we did in the US Tech 100.
These markets are beginning to form consolidation and range / sideways movements that we have not seen for a while because they have been running away highly for so long.
I discuss range trading and how to define it here at How to Trade a Range With Price Action
Learning how to trade and also manage a trade within a range is a key skill because the markets range far more often then they are trending and being able to manage trades, cut losses and understand where you should be appropriately taking profits is key.


Leave a Reply