How to Use Support and Resistance With Price Action
How good you become at marking key support and resistance levels will decide how good you become at trading.
Huge call? Maybe.
However; think about this, ALL of your trading is based around where you mark your support and resistance levels.
The biggest traders in the world including banks, brokers, market makers all use support and resistance.
Have a look at the big banks technical outlooks that include support and resistance like Citibank weekly charts outlook or check out the big brokers who include their levels like IC Markets support and resistance level here and also HERE.
Not only will you use these levels to find trades, but the same methods will be used to find targets to take profit, and crucially mark up your stop loss.
You will use these levels on every time frame you trade and for every single trade, and your whole price action story will be based around them.
There are many variables to becoming a good trader. However; if you get this part wrong it is hard to make high probability repeatable trades that follow the same rules and trading plan.
What is Support and Resistance?
I have read a lot of traders say and make comments similar to “support and resistance does not work’, “support and resistance is guesswork’, or “support and resistance cannot be repeated accurately”.
To any trader who is continually marking up support and resistance and seeing price move past their levels or through them and back higher or lower, this is understandable and frustrating.
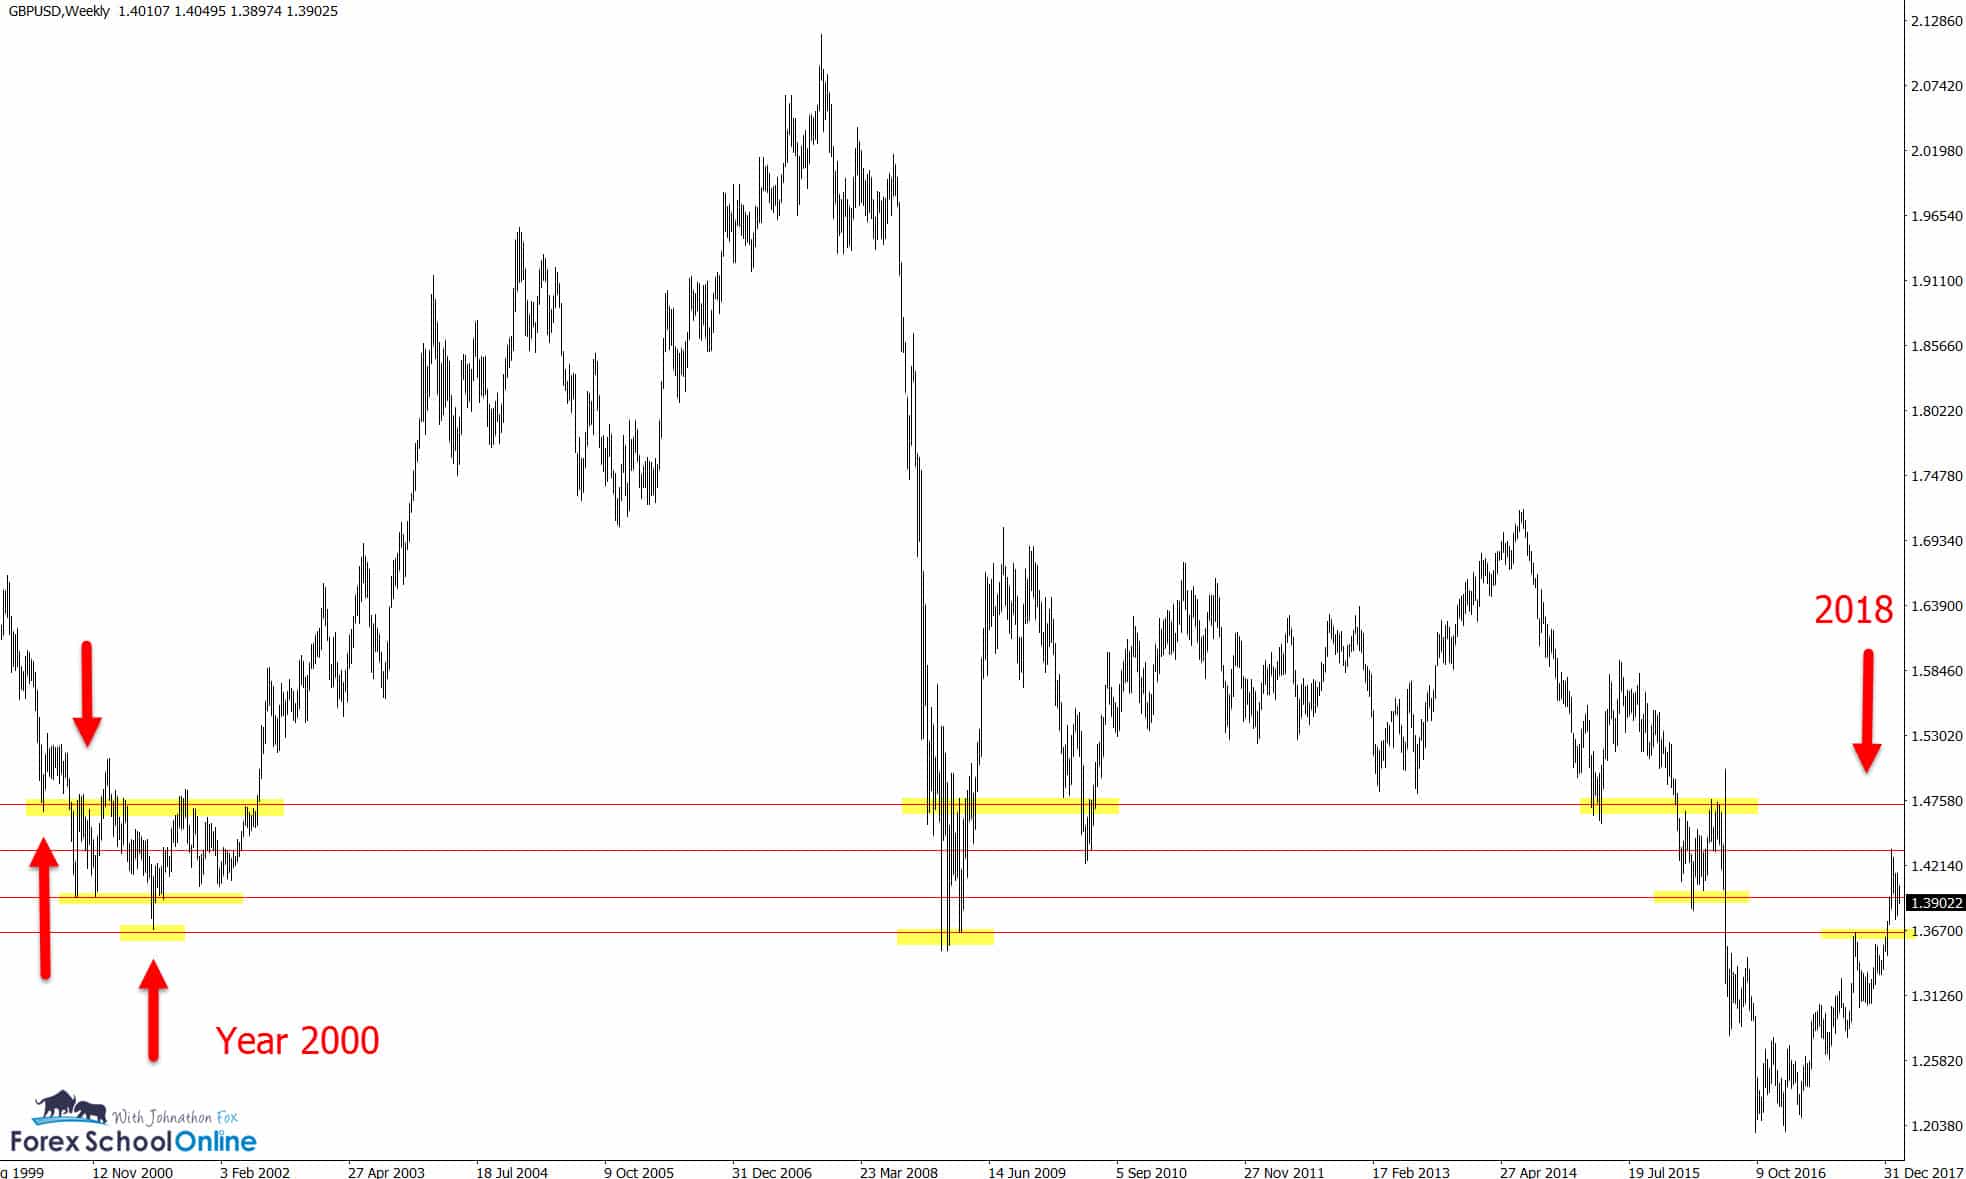
The easiest way to show support and resistance levels at work is to show how the same levels repeat over and over again and explain exactly why they are doing this.
Have a look at the chart below of the same levels repeating for 20+ years.
Is it Just Experience?
How as a trader do we learn to mark levels we have confidence in and can base our trading around? Is this just a matter of experience and time, or learning how to do it properly?
It is a mixture of both. If you continually learn, watch and are marking the wrong levels, they will not magically change into good levels all of a sudden.
A terrible golfer does not all of a sudden have their golf swing transformed or a singer does not walk into karaoke and start belting out tunes like a legend 😝
You first need to have learned the key concepts and crucial education and then you can combine that with experience to perfect it. The good golfer gets better and the good singer becomes great.
Why are Levels Repeating for Year after Year?
Lets for a moment pretend we are going to a market to buy some cows.
We obviously want to buy the cows as cheap as possible, just like everyone else.

The auctioneer offers the cows up at $1000 and no one bids, he drops to $900 and still no bid to buy them, then he drops lower to $800 and lower still to $600 and then all of a sudden five bidders all jump in flashing their numbers up to buy the cows. BOOM!
Price quickly rises and rises until the cows are sold at $750. What happened?
When price moved lower to $600 this was the support level an where price found demand.
Why use this example? Because often people do not think of the markets as people, traders and real money.
This is where price had buyers waiting to move in. It is where a group of orders had been set or in the trading market ‘traders’ are often waiting at a support or resistance level they have been watching and waiting on with large orders in the markets to enter or exit.
When these orders are stops in the case of a quick market reversal or false break this can be dynamic and quite stunning and people are taken out of their positions without notice or have to exit as price moves against them.
I go into this in more depth in the lesson;
What is Supply and Demand in Forex Trading?
What Time Frames Should You Be Using to Mark Your Support and Resistance?
To answer this question you need to consider the time frames you want to trade and the type of trader you are or want to be.
If you are making trades on the daily chart and below, then the key time frame is the daily chart.
The daily chart is like an anchor for trading and other time frames.
The daily chart gives the clearest picture of support and resistance and the levels price is respecting and flipping.
A major key to marking levels on the daily chart is not only does it allow trades to be placed on the daily time frame, but traders who want to move to smaller intraday time frames and make traedes can do so using the same daily charts levels with confidence.
If a trader moves to a smaller timeframe and uses the daily level they know the are using a major level and not a potentially minor intraday level.
Read a full stepped out marking of support and resistance routine lesson
How do You Find Your Support and Resistance Levels?
The charts used below are from the last Weekly Charts in Focus Summary I posted where I discussed the US30 and Bitcoin markets.
Even though both of these markets had made huge sell-offs in the recent days before that post they both could have their major levels marked.
Read the hundreds of charts in focus posts including that one here.
Of course; it is not just support and resistance. It is being able to read the whole price action story and what is going on around the price action clues, but the support and resistance / supply / demand plays a huge role.
Have a look at both charts below;
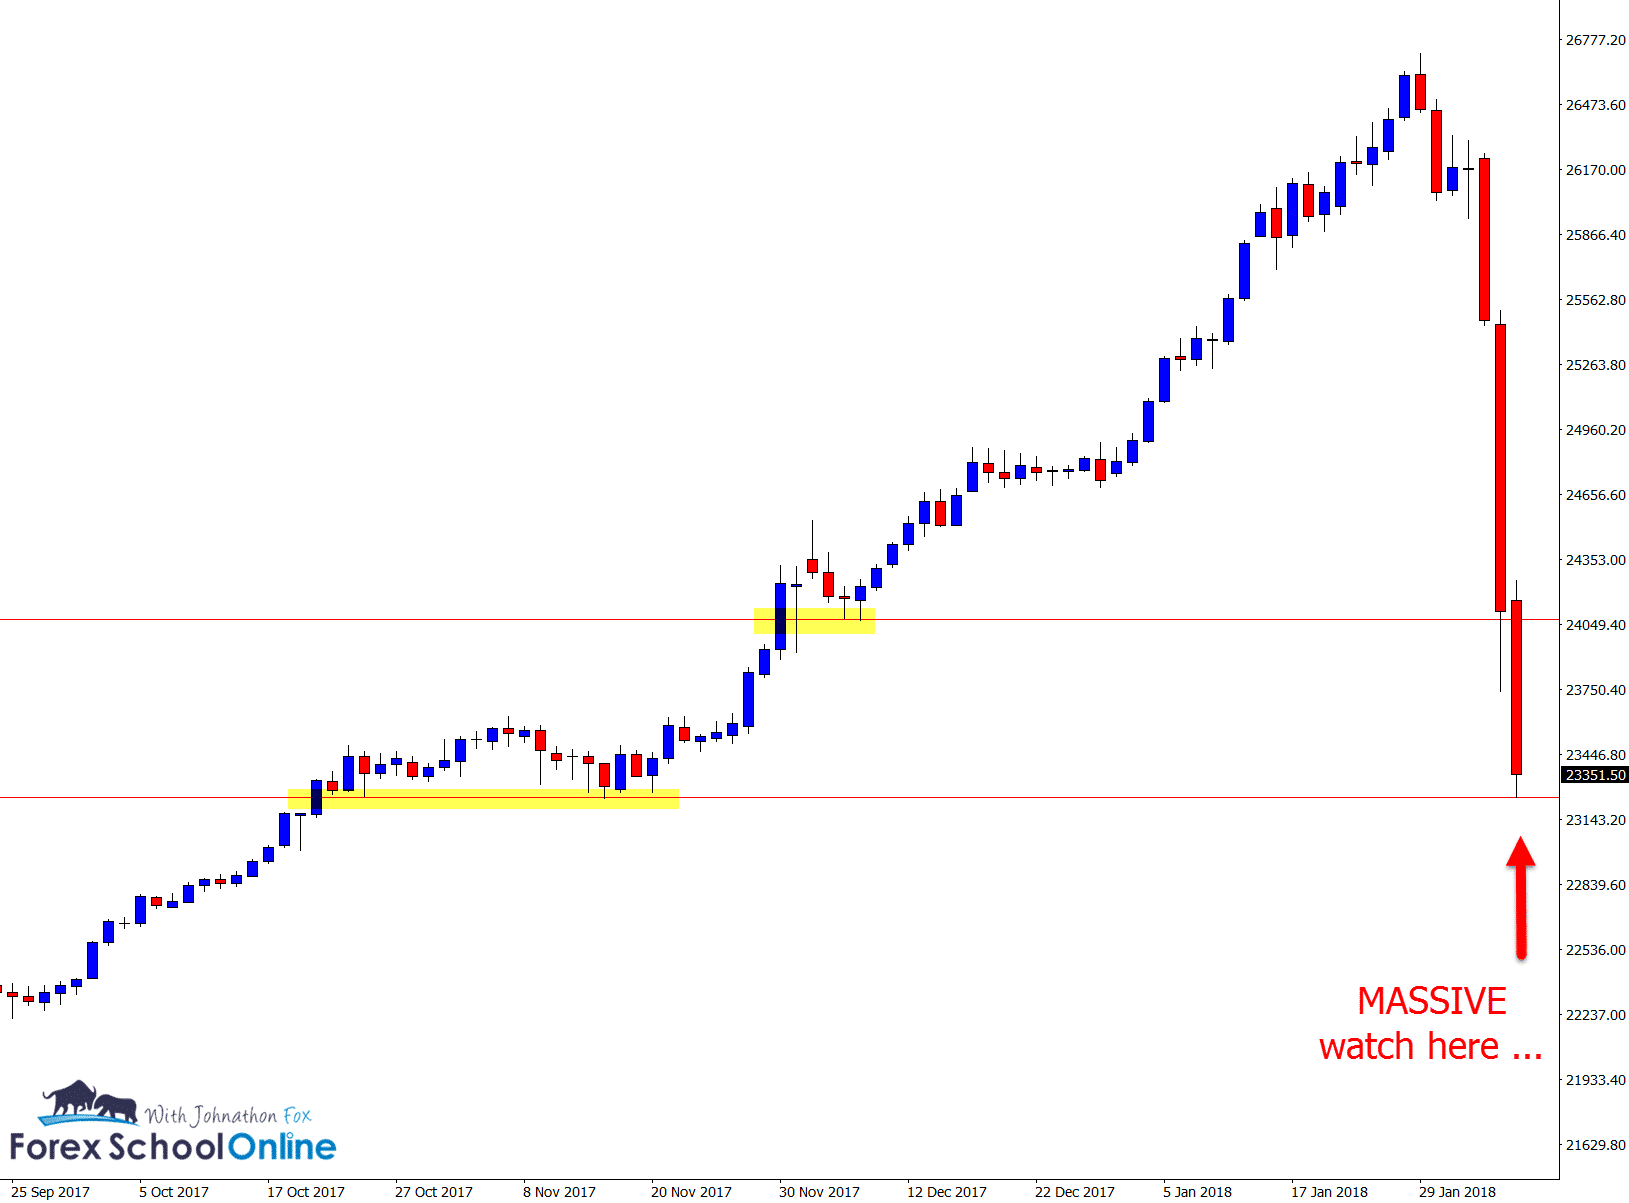
US30 Daily Chart Moving Into Major Support After HUGE Sell Off
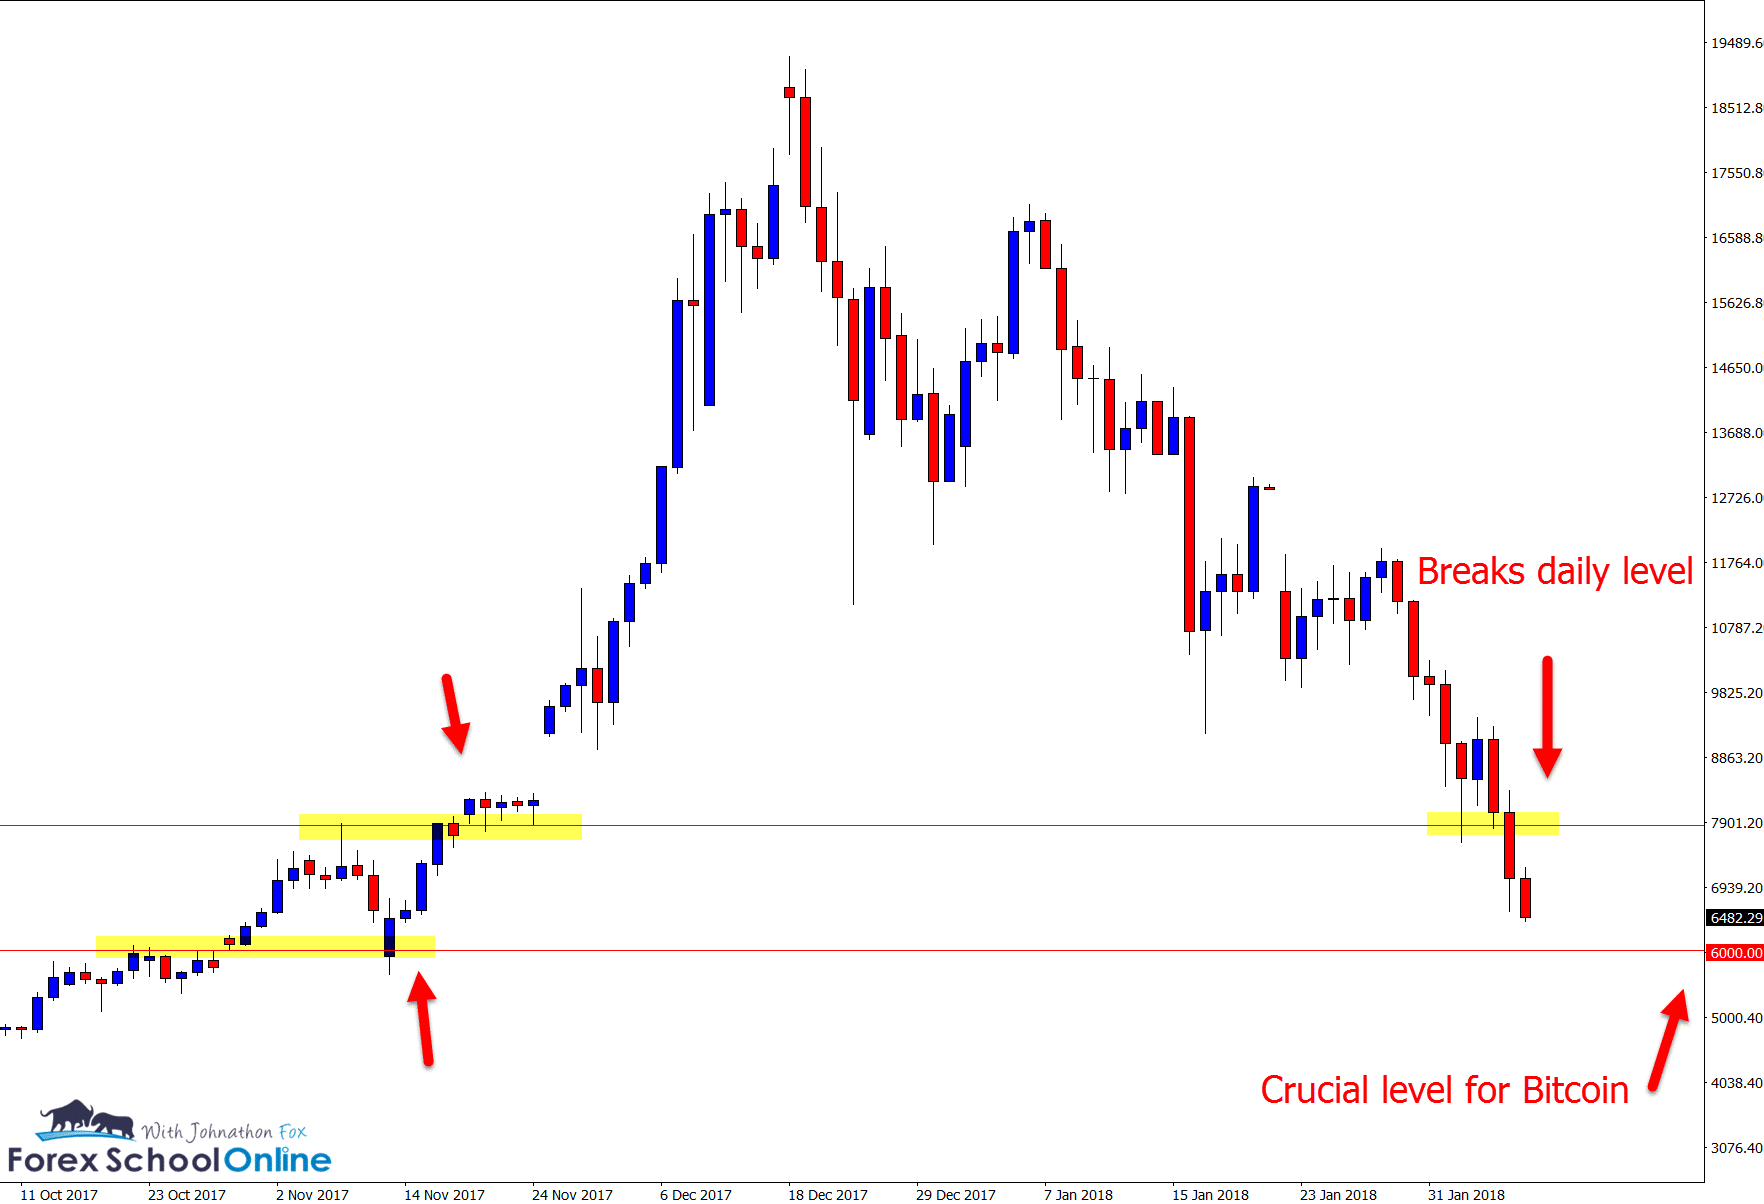
Bitcoin Daily Chart – Breaks Below Major Level and Potentially Moves into ‘Big Round Number’ & Support 6000.
Your Levels Are the Base for the Whole Price Action Story!
These levels are crucial for the direction you look to trade the market and the assessment whether you are potentially looking to make smaller time frame trades.
They will help you with the A+ high probability trades you make and bring all of the other price action story together including other key aspects like;
- Trends
- Momentum
- Swing points
- Value areas
- Reversals
- Trigger signals
If you want to make high probability trades, then you need to lock down and become a master of support and resistance levels.
If you want a complete introduction guide to price action trading then get your PDF below.
Any questions then post them below.

Leave a Reply