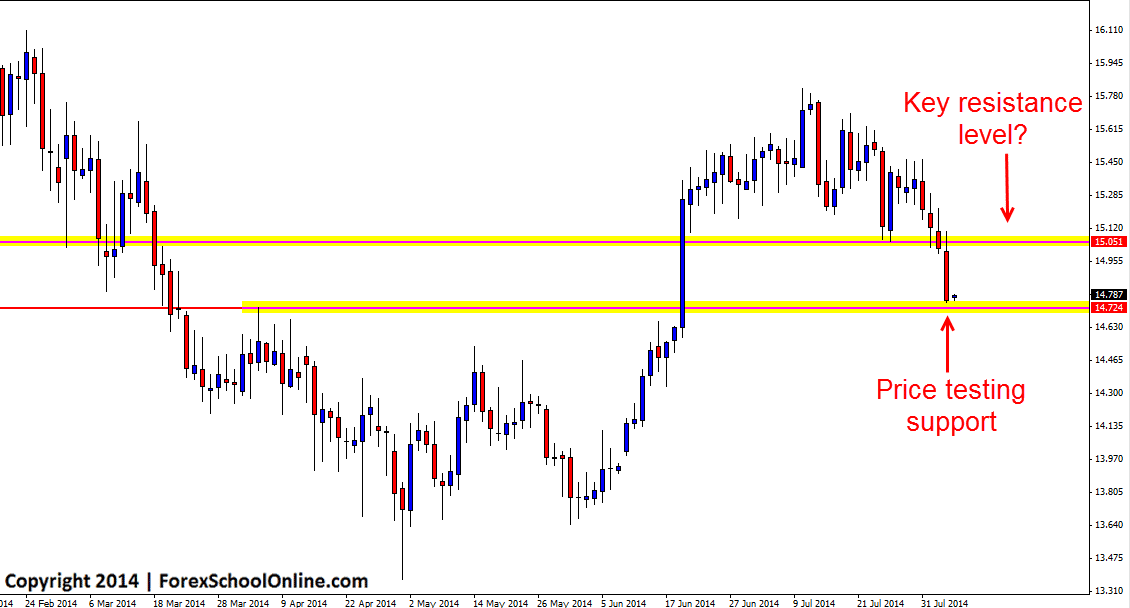
Silver has crashed lower and into a daily key support level with price as I write this blog post testing the level on the daily and four hour charts to see if it can hold above or break below. This level could prove crucial for where price moves in the coming days and weeks for this market because after being wound up and caught in such a tight box on the daily chart, price has now finally burst out lower and if price can now consolidate that break by making another solid move and through the support level, a serious move lower could be on the cards. If that happens and the support level breaks, it could then look to act as a price flip level and hold as a potential new resistance that would contain price below it.
Until that happens, traders need to let the price action guide them and the higher time frame charts are the best indication to start with as to where price is looking to go. Aggressive traders could look at this support level and look for bullish price action clues to see if price is looking to reject this support level and make a break back higher with long trades. This is the more aggressive approach because the recent momentum has been lower and for any potential long trades there would need to be a very strong bullish price action trigger signal to confirm the setup.
If price does pull back higher there is a very solid daily key resistance level as shown on the daily chart below. This level was a previous support level that price recently broke out lower through and could now potentially act as a new price flip resistance level should price move back higher. This would be a really solid level to look to trade with the recent strong momentum and traders could look to target short trades both on their daily and intraday charts such as their 8hr and 4hr charts.
Daily Silver Chart


Leave a Reply