British Pound Price Prediction – June 15
The GBP/USD market activity currently breaks down at the lower range trading zone of 1.4100. The currency pair’s value as of writing is traded at around the level of 1.4074 at a rate of -0.21 percent.
GBP/USD Market
Key Levels:
Resistance levels: 1.4200, 1.4300, 1.4400
Support levels: 1.4000, 1.3900, 1.3800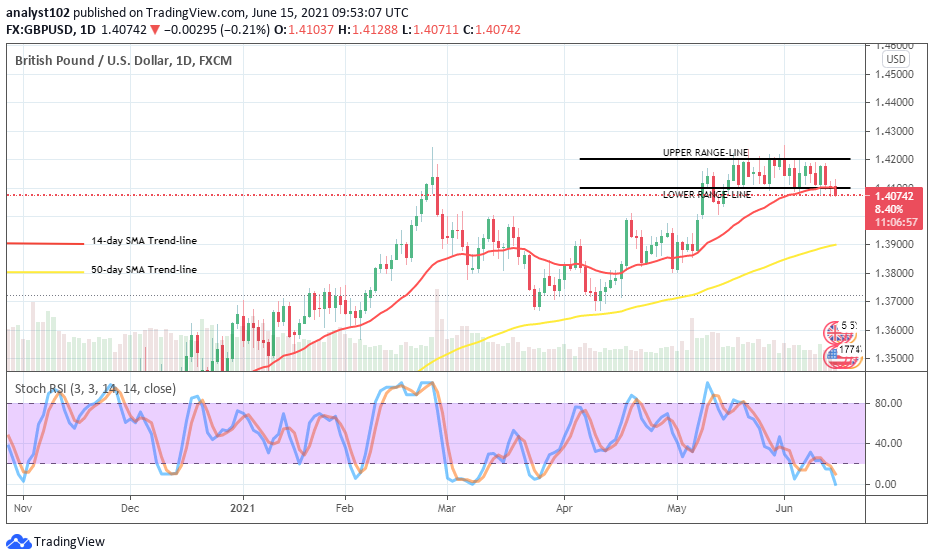 GBP/USD – Daily Chart
The GBP/USD daily chart now depicts that there is a downward force signaling a start of breaking southward away from long-kept range-bound trading zones of 1.4200 and 1.4100. The lower range-line and the 14-day SMA trend-line are located at the lower range trading value. And, they have slightly breached to the south as the 50-day SMA indicator is located underneath them at 1.3900 level. The stochastic Oscillators have slantingly moved into the oversold region. And, yet, they cross the lines pointing to the southbound in it to indicate that a downside move has taken up the market space presently.
Could the present early breaking down of the GBP/USD market’s lower range trading spot last long?
Over several weeks of session, the market operations between GBP and the USD have converged closely above the value of 1.4100 without a notable record of price attempting to break down the smaller SMA. But, now, there has been such a scenario indicating a slight return of potential down run of this currency market. A reversal against the level of 1.4100 as of now, may lead to decimating that analytical write-up in no time.
Regarding a stable continuation of the current fresh lower range breakdown of this market, as it is indicated by the Stochastic Oscillators’ reading, bears needed now than ever have to display a kind of very strong consolidation moving manner. A long well-formed bearish candlestick from the point of the lower range zone will most likely allow for further free fall-offs in the next sessions to possibly aim at touching a lowly value around the bigger SMA at a later time.
Summarily, a long bearish formation of a Japanese candlestick around the lower range trading at 1.4100 will most likely allow the GBP/USD pair to set on a downward move to a lower point. But, a reversal against the point earlier mentioned will potentially invalidate the current break downforce.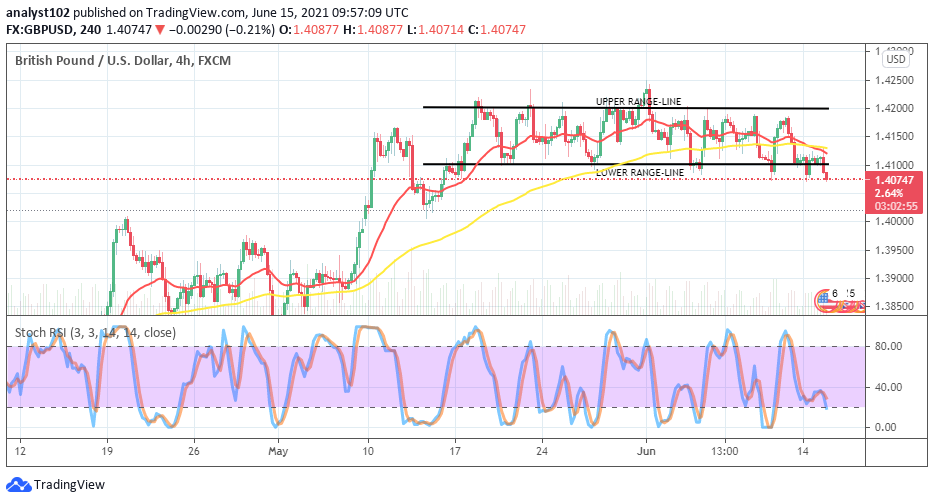 GBP/USD 4-hour Chart
On the medium-term chart, the GBP/USD market has now seen an interception of the bigger SMA by the smaller SMA from the top in a strong confirmation that a downward move is on a higher note as the lower range spot has equally breached to the south. The 14-day SMA trend-line now points to the south slightly below the 50-day SMA indicator. The Stochastic Oscillators have the lines in between ranges of 40 and 20 pointing to the south signaling strong support to now possibly begin to see the downside featuring in this currency pair’s trading situation. However, traders are advised to avoid late entry of placing positions.
Note: Forexschoolonline.com is not a financial advisor. Do your research before investing your funds in any financial asset or presented product or event. We are not responsible for your investing results.
Learn to Trade Forex Online
GBP/USD Market Breaks Down at the Lower Range
Footer

ForexSchoolOnline.com helps individual traders learn how to trade the Forex market
WARNING: The content on this site should not be considered investment advice and we are not authorised to provide investment advice. Nothing on this website is an endorsement or recommendation of a particular trading strategy or investment decision. The information on this website is general in nature so you must consider the information in light of your objectives, financial situation and needs.
Investing is speculative. When investing your capital is at risk. This site is not intended for use in jurisdictions in which the trading or investments described are prohibited and should only be used by such persons and in such ways as are legally permitted. Your investment may not qualify for investor protection in your country or state of residence, so please conduct your own due diligence or obtain advice where necessary. This website is free for you to use but we may receive a commission from the companies we feature on this site.
We Introduce people to the world of currency trading. and provide educational content to help them learn how to become profitable traders. we're also a community of traders that support each other on our daily trading journey
Forexschoolonline.com is not a financial advisor. Do your research before investing your funds in any financial asset or presented product or event. We are not responsible for your investing results.
Leave a Reply