Traders at all levels use charts to analyse the markets direction and decide whether or not to place a trade.
The most common and popular types of charts that are used are in today’s trading are;
- Line charts
- Bar charts
- Candlestick charts
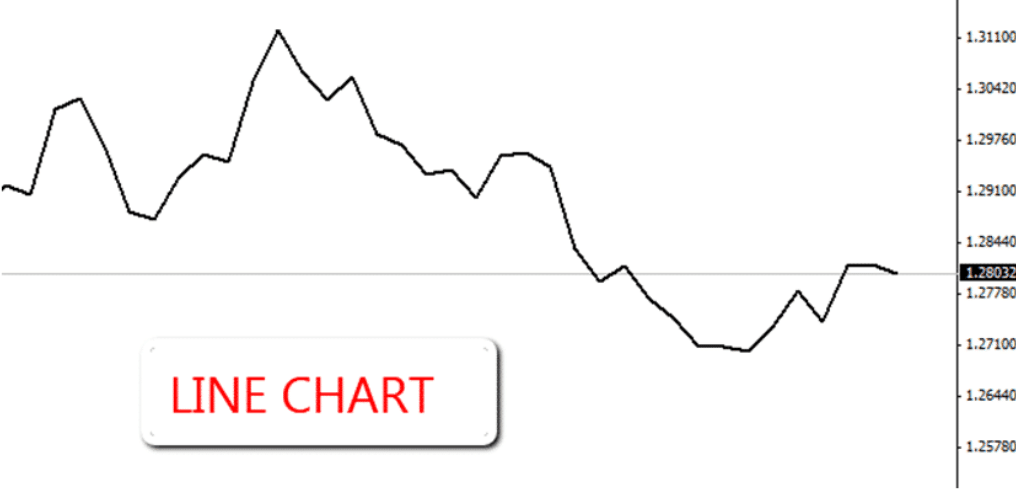
Line Chart
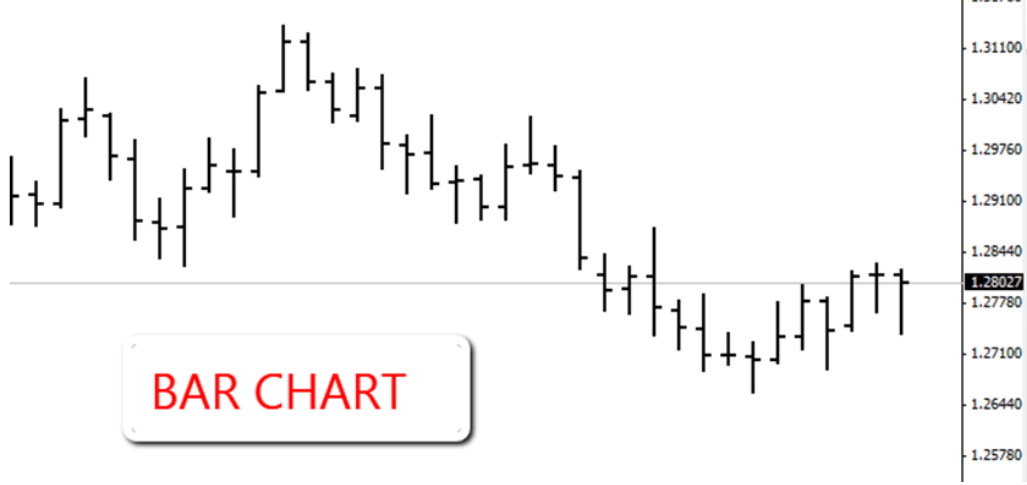
Bar Chart
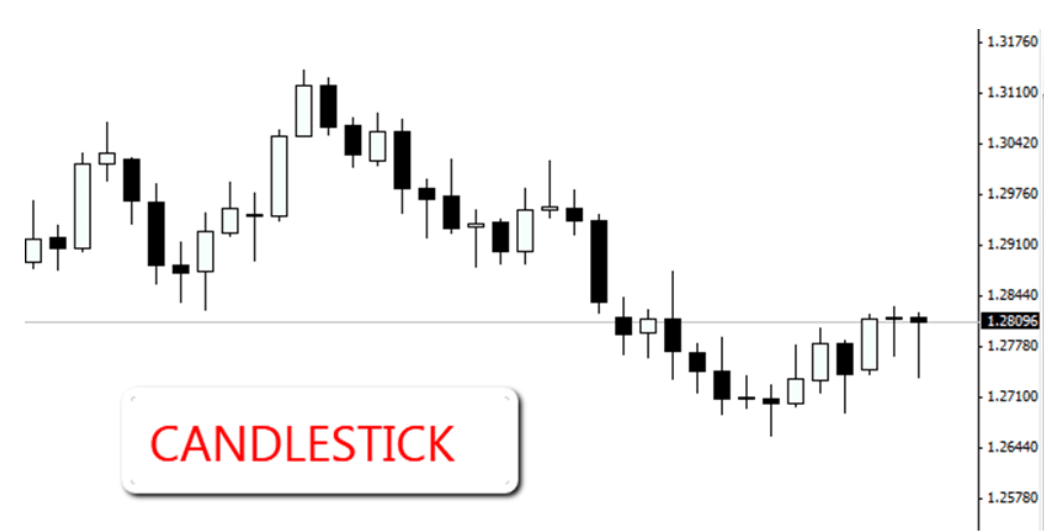
Candlestick Chart
All three charts shown above are of the same market and time frame.
As you can see, the price action picture gets clearer as you move down to the candlestick charts. These charts show us the best information as to what price is doing even to an untrained eye.
Line Chart
A line chart is the simplest chart and is formed by drawing a line from one closing price to the next.
When all of the closing prices are added to create the line we can see a general picture of where price is moving. This form of chart is simple, but does leave some crucial elements out.
Bar Chart
A bar chart is another step forward from the line chart with more information added.
A bar chart shows you the opening and closing prices along with the particular time frames highs and lows.
As you can see from the image below; the bar shows where price opened on the left of the bar, how low it moved down, how high it traded up to and where it closed.
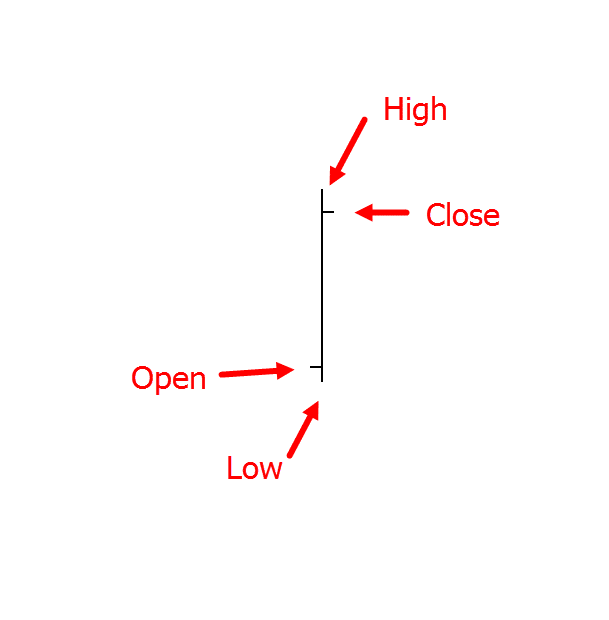
Along with the candlestick, a ‘bar’ is one time period of information. This can be any time period you choose, for example; the 15 minute chart or daily chart.
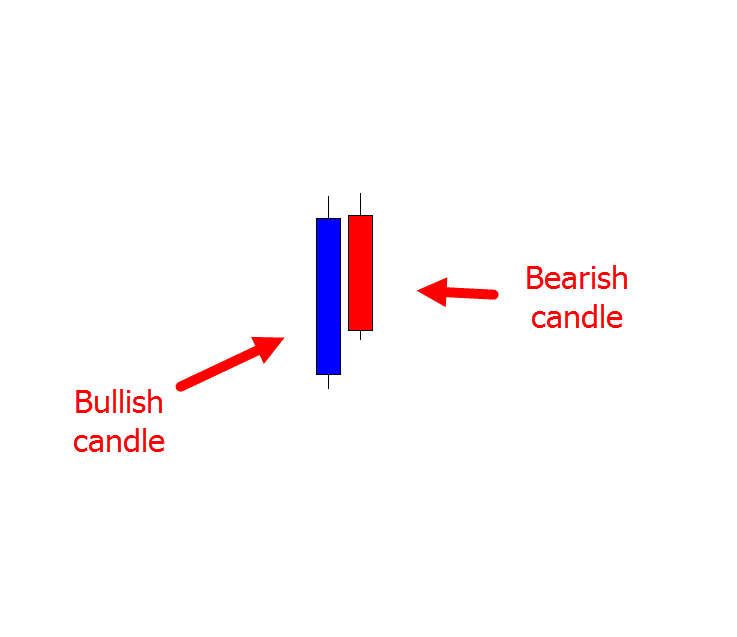
Candlestick Chart
Candlestick or Japanese candlestick charts are what we use here at Forex School Online and what you will find in all of our graphics.
The candlestick includes the same information as the bar chart; the high, low, open and close, but it is easier to quickly read and decipher because of the candles body.
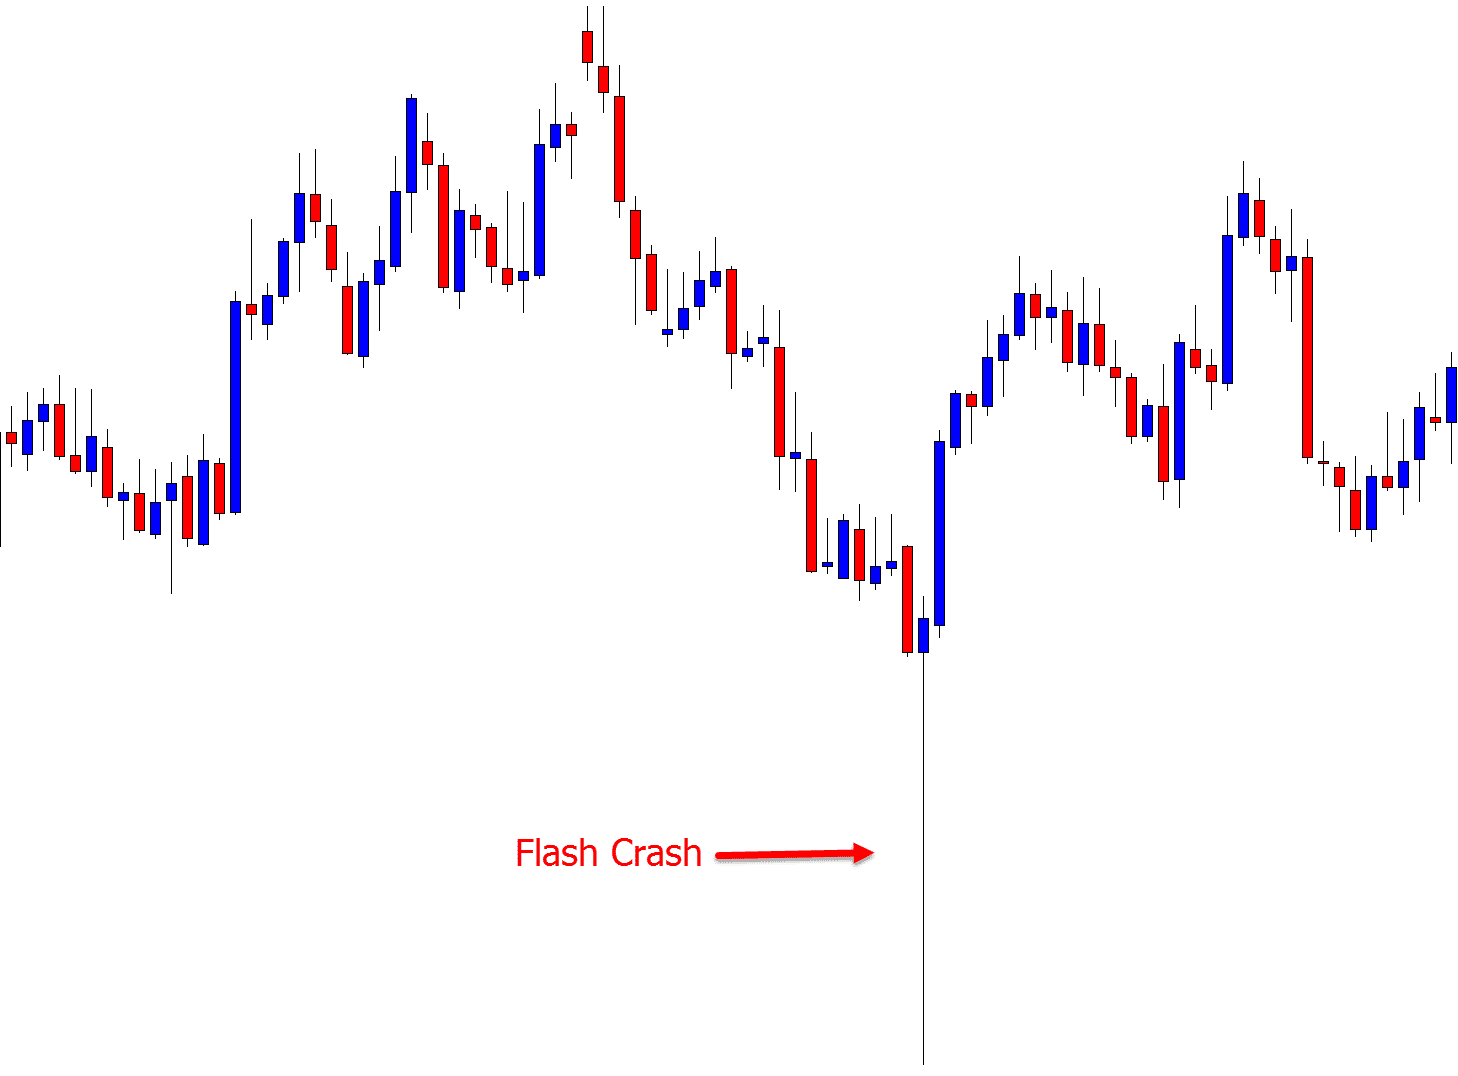
Below is an example of a candlestick. You are able to change and choose the colors to how you prefer them. In the example below; blue indicates price closed higher and red indicates price closed lower. The ‘wicks’ of the candles show how high and low price traded during the session.
Correct New York Close Time Charts
The unofficial Forex daily close is 5pm New York.
With this in mind it is very important that you use the charts that reflect these timings. The best and most accurate charts to use are New York close 5 Day charts. This means that there are 5 candles per week and the daily candle closes at the end of the New York session.
Having your charts set up this way means you will get a true indication of the market with the candle opening with the Asian session and closing with the US session close.
I highly advise using the industry standard MT4. A link to the correct free New York close demo charts can be found at New York Close 5 day MT4 Charts.