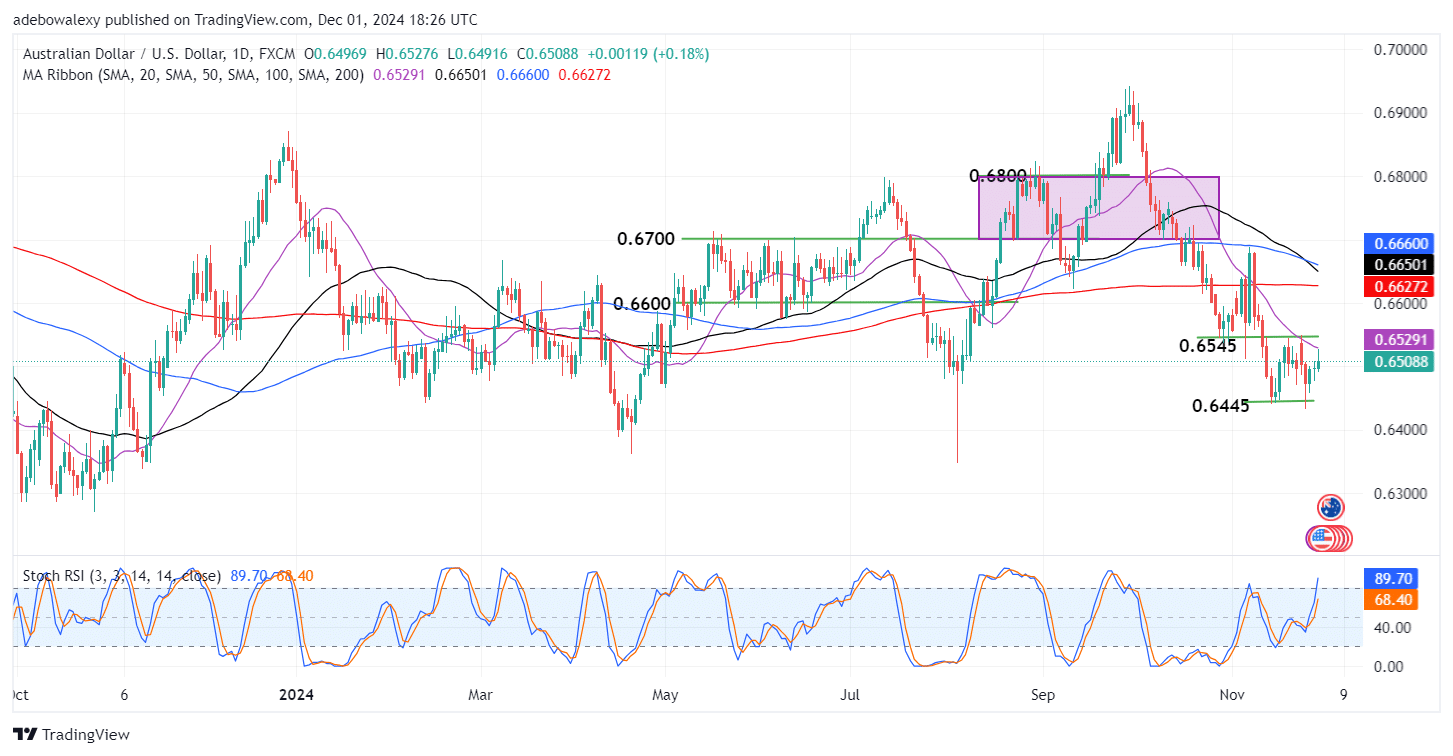
The AUDUSD market has been trading within a narrow price range for about 14 sessions. Yet, technical indicators aren’t showing much optimism. Despite the Friday session ending in the green, bearish effects were evident through some downward contractions.
Key Price Levels:
Resistance Levels: 0.6600, 0.6700, 0.6800
Support Levels: 0.6445, 0.6345, 0.6245

AUDUSD Bulls Encounter a Bearish Push-Back
As noted earlier, the AUDUSD market ended the previous week in the green. This was evident in the last price candle on the chart. However, with such minimal progress, the Stochastic Relative Strength Index lines appeared overextended, reaching high into the overbought region.
Meanwhile, the last price candle contracted back below the 20-day Moving Average (MA) line after testing it as resistance. Consequently, price action has retreated below all the MA lines. Nevertheless, the ongoing session remains green, indicating that upside forces are still maintaining some influence in the market.

AUDUSD Hits a Barrier Too Soon
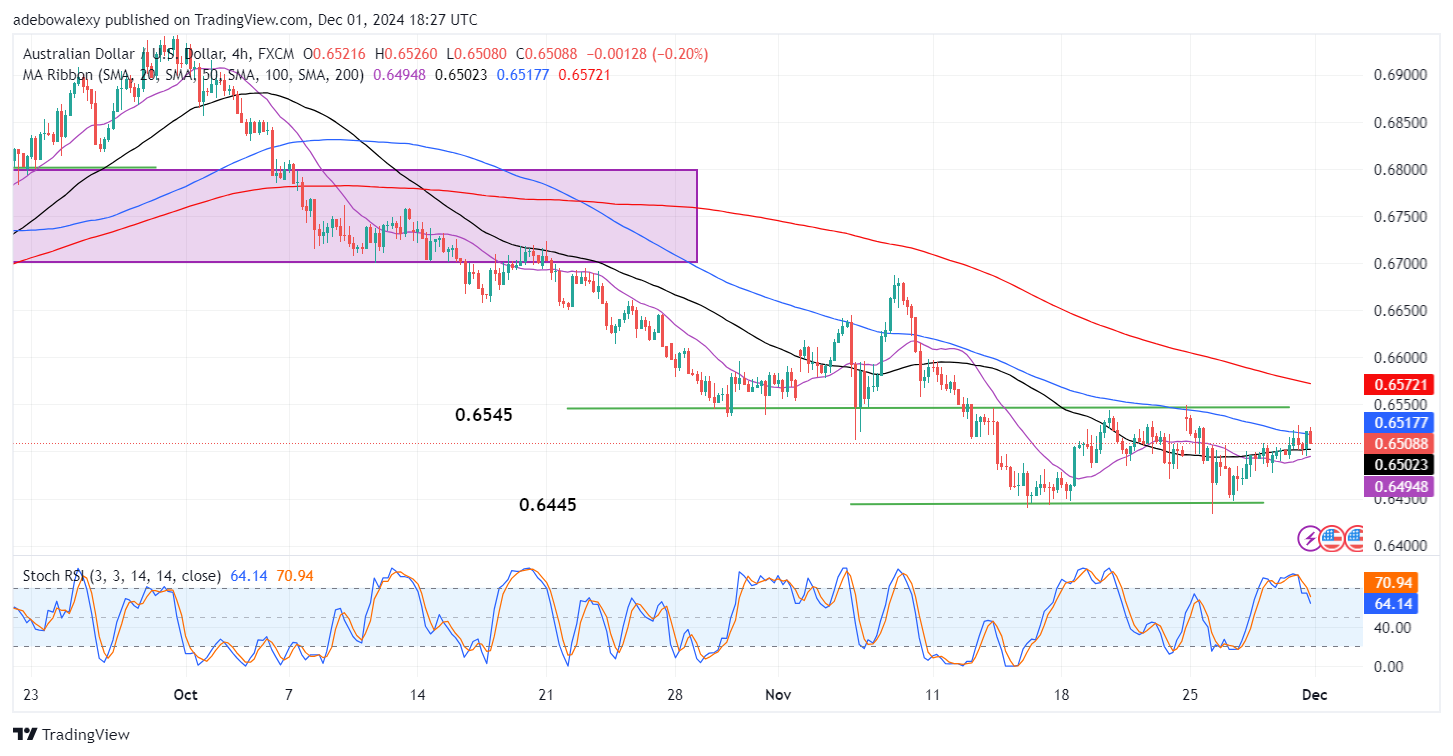
Moving to the AUDUSD 4-hour chart reveals that price action has hit a resistance level below the 0.6544 resistance level. This resistance was found at the 100-day MA line. As a result, the market has retraced downward minimally but remains above the 20- and 50-day MA lines.
Similarly, the Stochastic RSI lines are falling sharply towards the 50 mark. Technically, this suggests that downward forces are likely to push harder towards the 0.6450 mark. However, this will depend on upcoming fundamentals, such as the Australian PMI later today and other releases tomorrow. Traders will have to monitor these for directional cues, as the US seems relatively quiet.
Do you want to take your trading to the next level? Join the best platform for that here.


Leave a Reply