Weekly Price Action Trade Ideas – 27th to 31st May
Markets Discussed in This Week’s Trade Ideas: EURUSD, USDJPY, USDSGD and EURGBP.
Note: We Use Correct ‘New York Close 5 Day Charts’ – You can read about why we use these and how to download the correct free charts at Correct Free New York Close Demo Charts
EURUSD Daily & 2 Hour Charts
Bulls Hold With Bullish Engulfing Bar
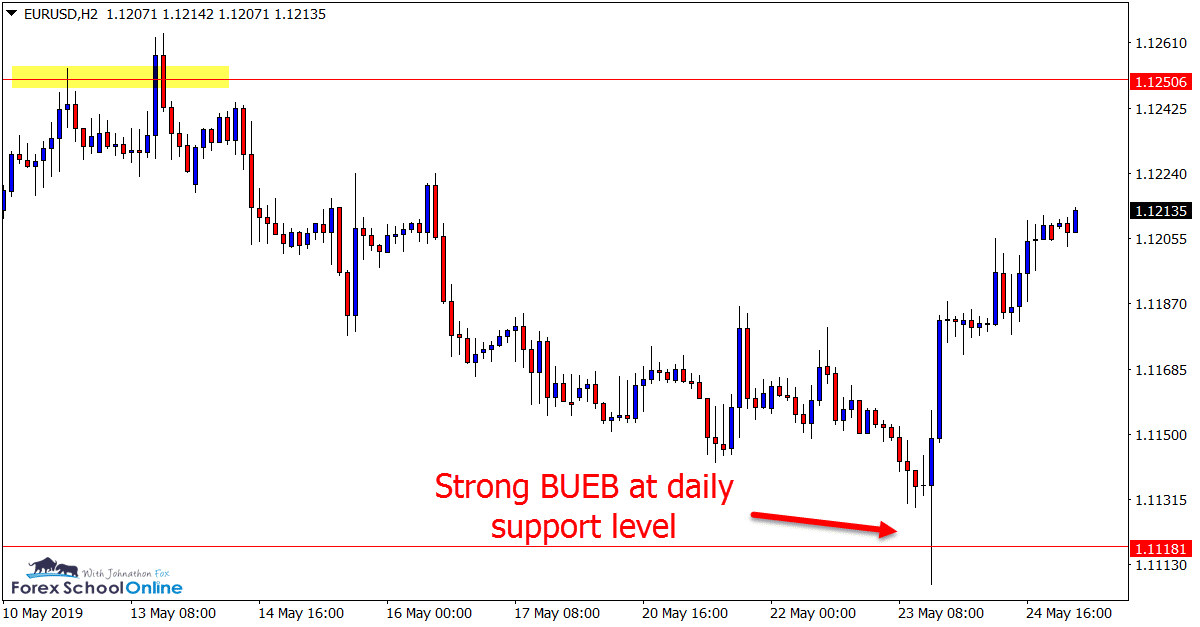
The daily chart support level that we discussed in last week’s trade ideas has so far managed to hold with the bulls aggressively pushing back higher.
As the daily and 2 hour charts show below; price quickly reversed at the daily support, forming a strong Bullish Engulfing Bar = BUEB on the 2 hour chart and moving back higher.
NOTE: You can create 2 hour charts and any other time frame you like on MT4 charts using this indicator: Change MT4 Time Frame Indicator
Price is now tracking back higher into the proven daily resistance that is a major watch over the coming sessions for potential bearish setups.
Daily Chart
2 Hour Chart
USDJPY Daily Chart
Big Watch Daily Support
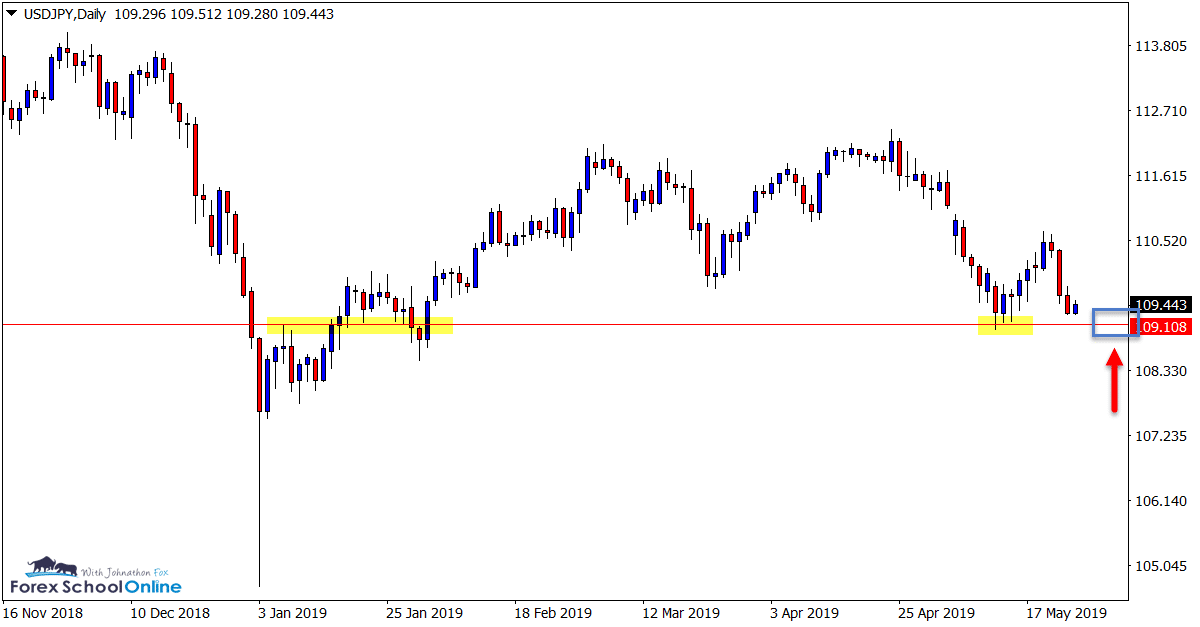
Similar to the EURUSD, the USDJPY is moving into its daily support level and looks an interesting watch for potential bullish price action reversal triggers.
Two weeks ago this support level acted as a swing low for price to make its most recent bounce higher and price is now looking to make another attempt at breaking lower.
This market has not had any clear trend in recent times with price ranging sideways. If price can fire off any A+ bullish triggers showing the bulls want to hold this level, it could be a solid level to look to get long.
Daily Chart
USDSGD Daily Chart
Daily Pin Bar Sends Price Lower
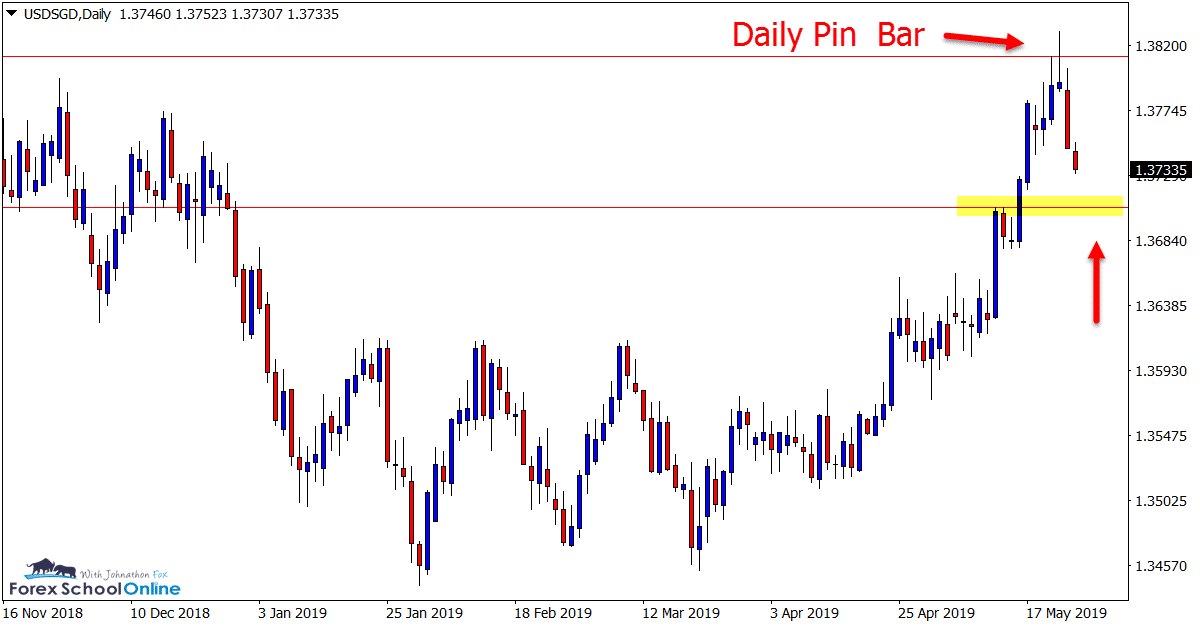
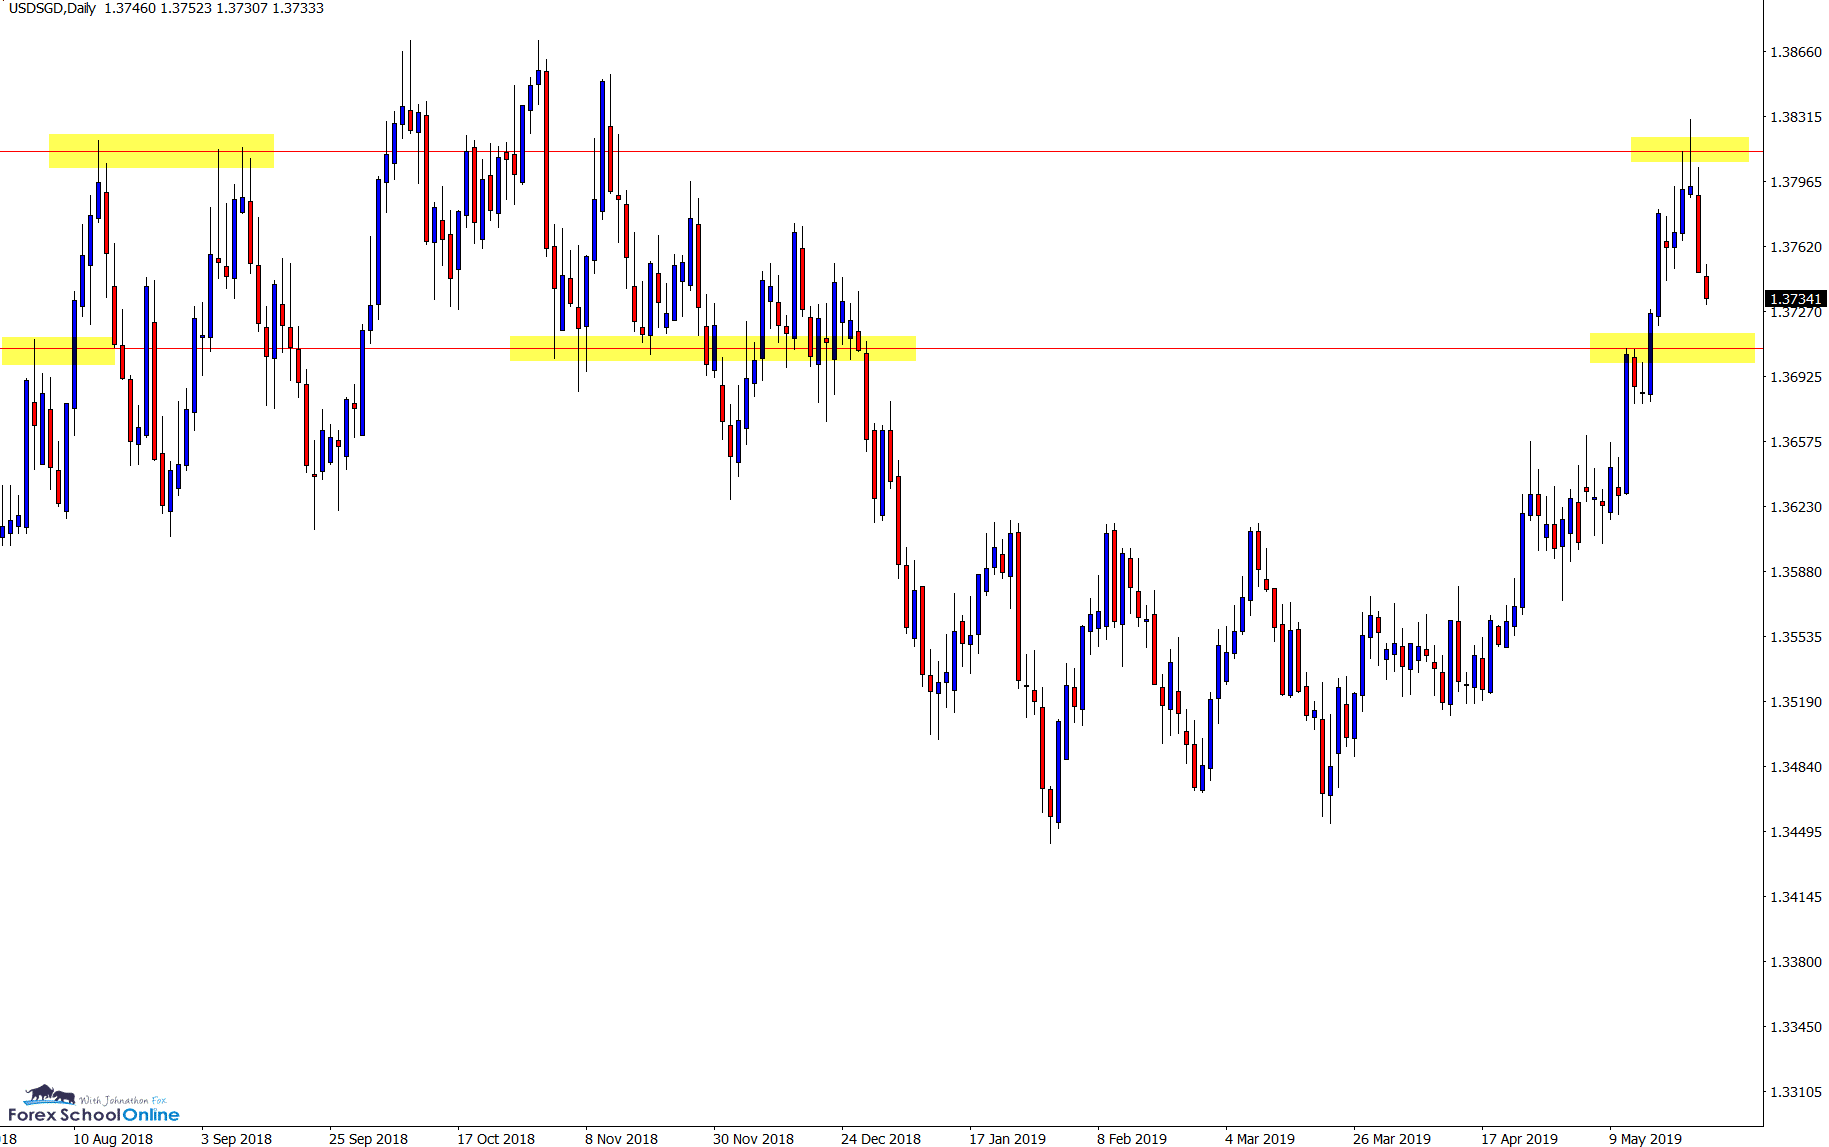
Price action on the daily chart of the USDSGD printed a counter trend pin bar that has seen price sell off lower.
Price has been trending aggressively higher in recent times before running into the daily chart resistance level and forming this pin bar.
Price is now tracking lower and into the next support level that could be a solid level to look for high probability bullish trigger signals to see if this move higher wants to continue.
Daily Chart
Daily Chart
EURGBP Daily & 2 Hour Charts
Price Pauses at Daily Resistance
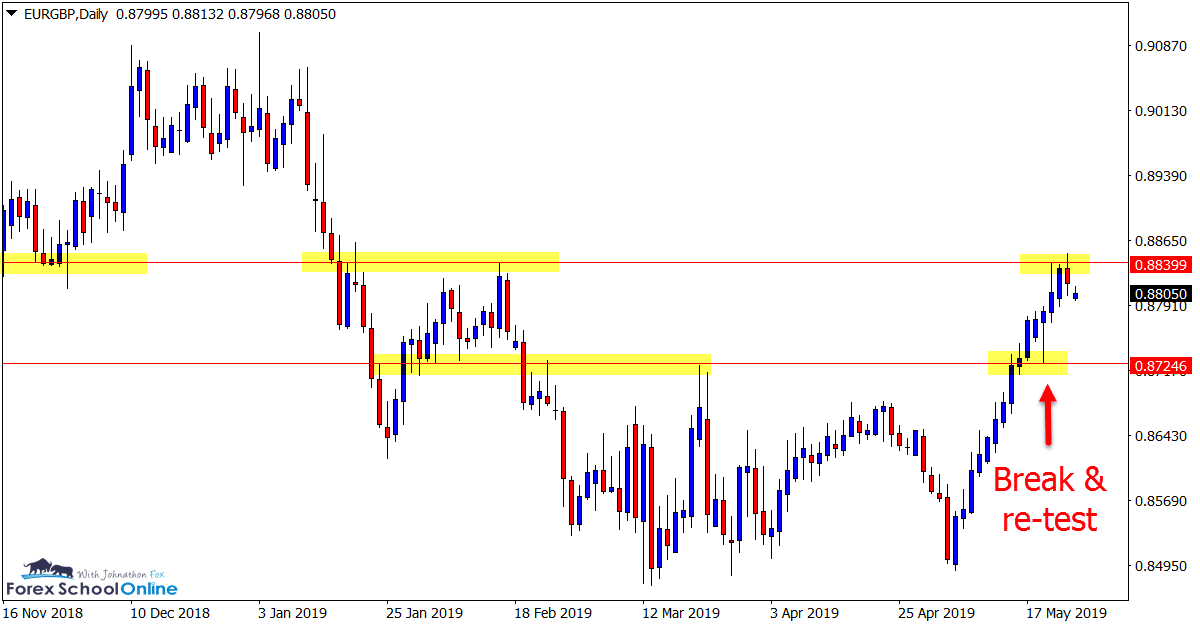
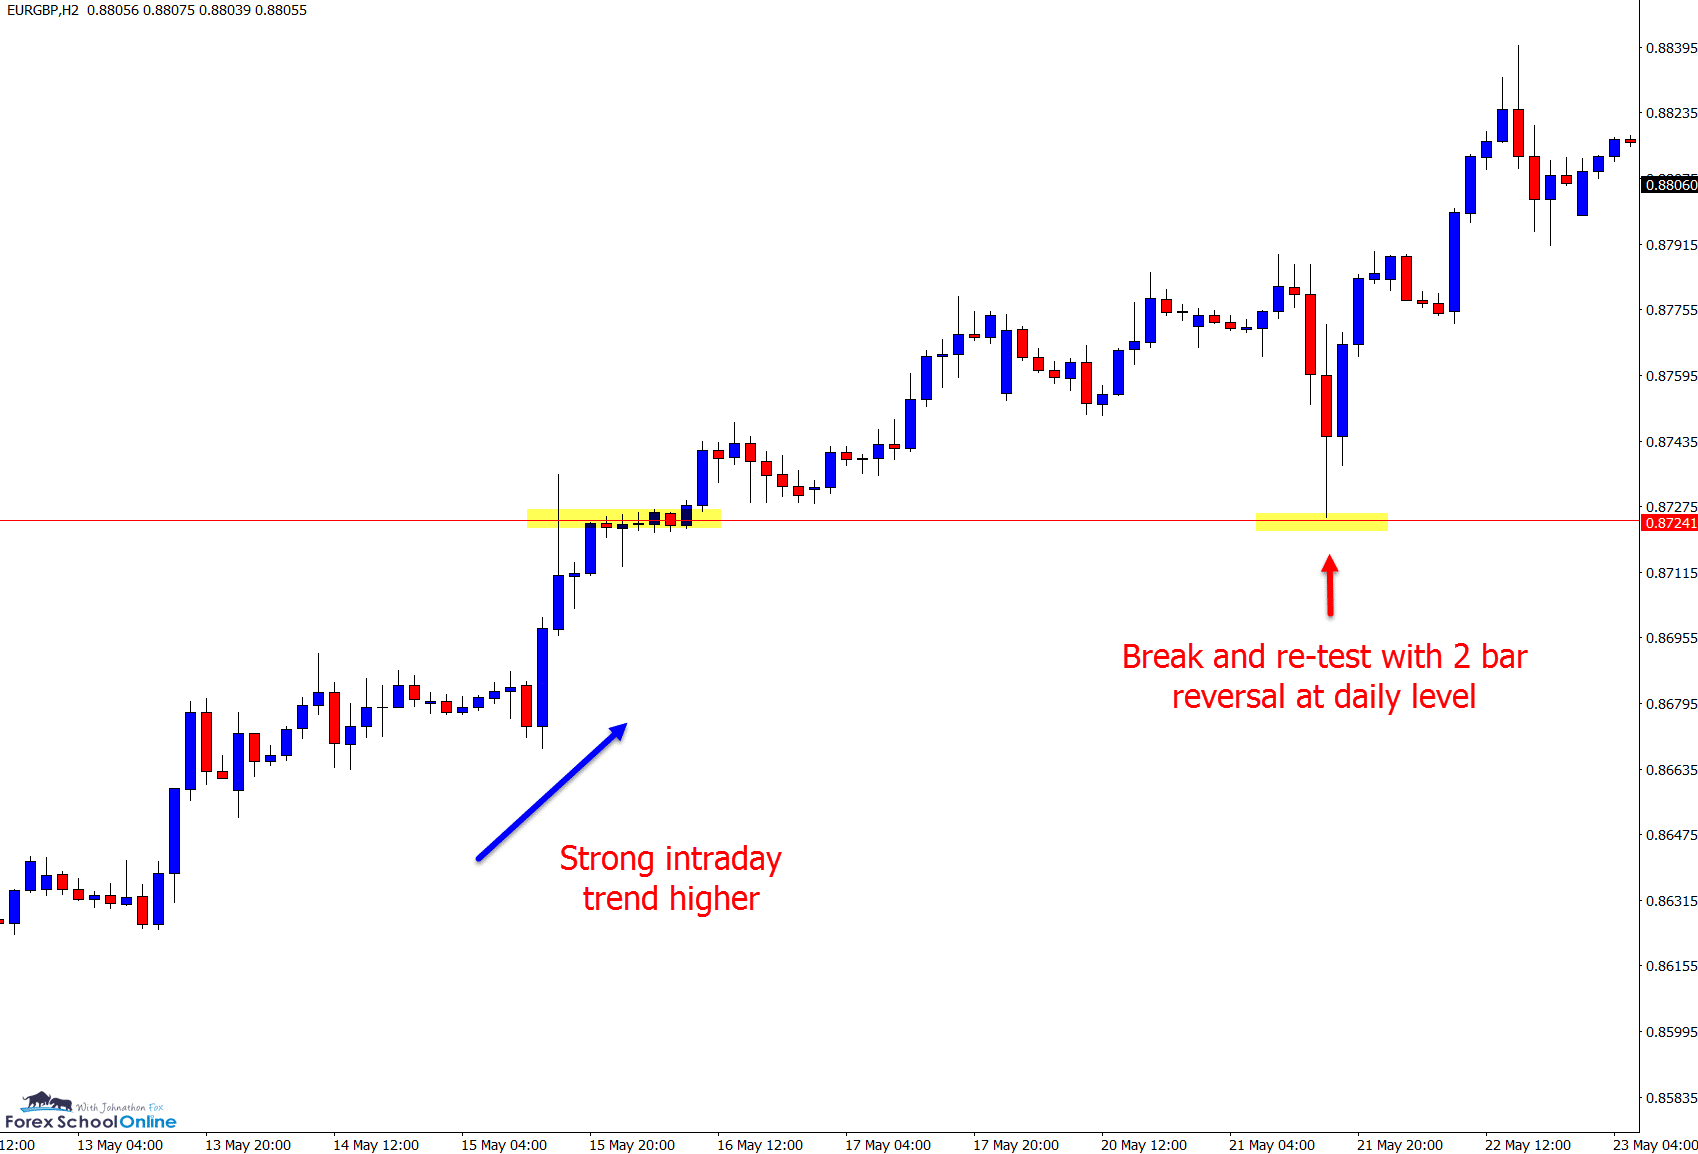
After breaking out and moving strongly above the daily resistance, price quickly snapped back, made a quick re-test of the old resistance / new support price flip before continuing.
The 2 hour charts below show this strong move, quick break and then re-test the clearest.
Price on the daily chart has now paused after running into a major daily resistance level.
If price can rotate lower and back into the same price flip support, bullish traders could hunt for long trades if any A+ price action presents.
Daily Chart
2 Hour Chart
2 Hour Chart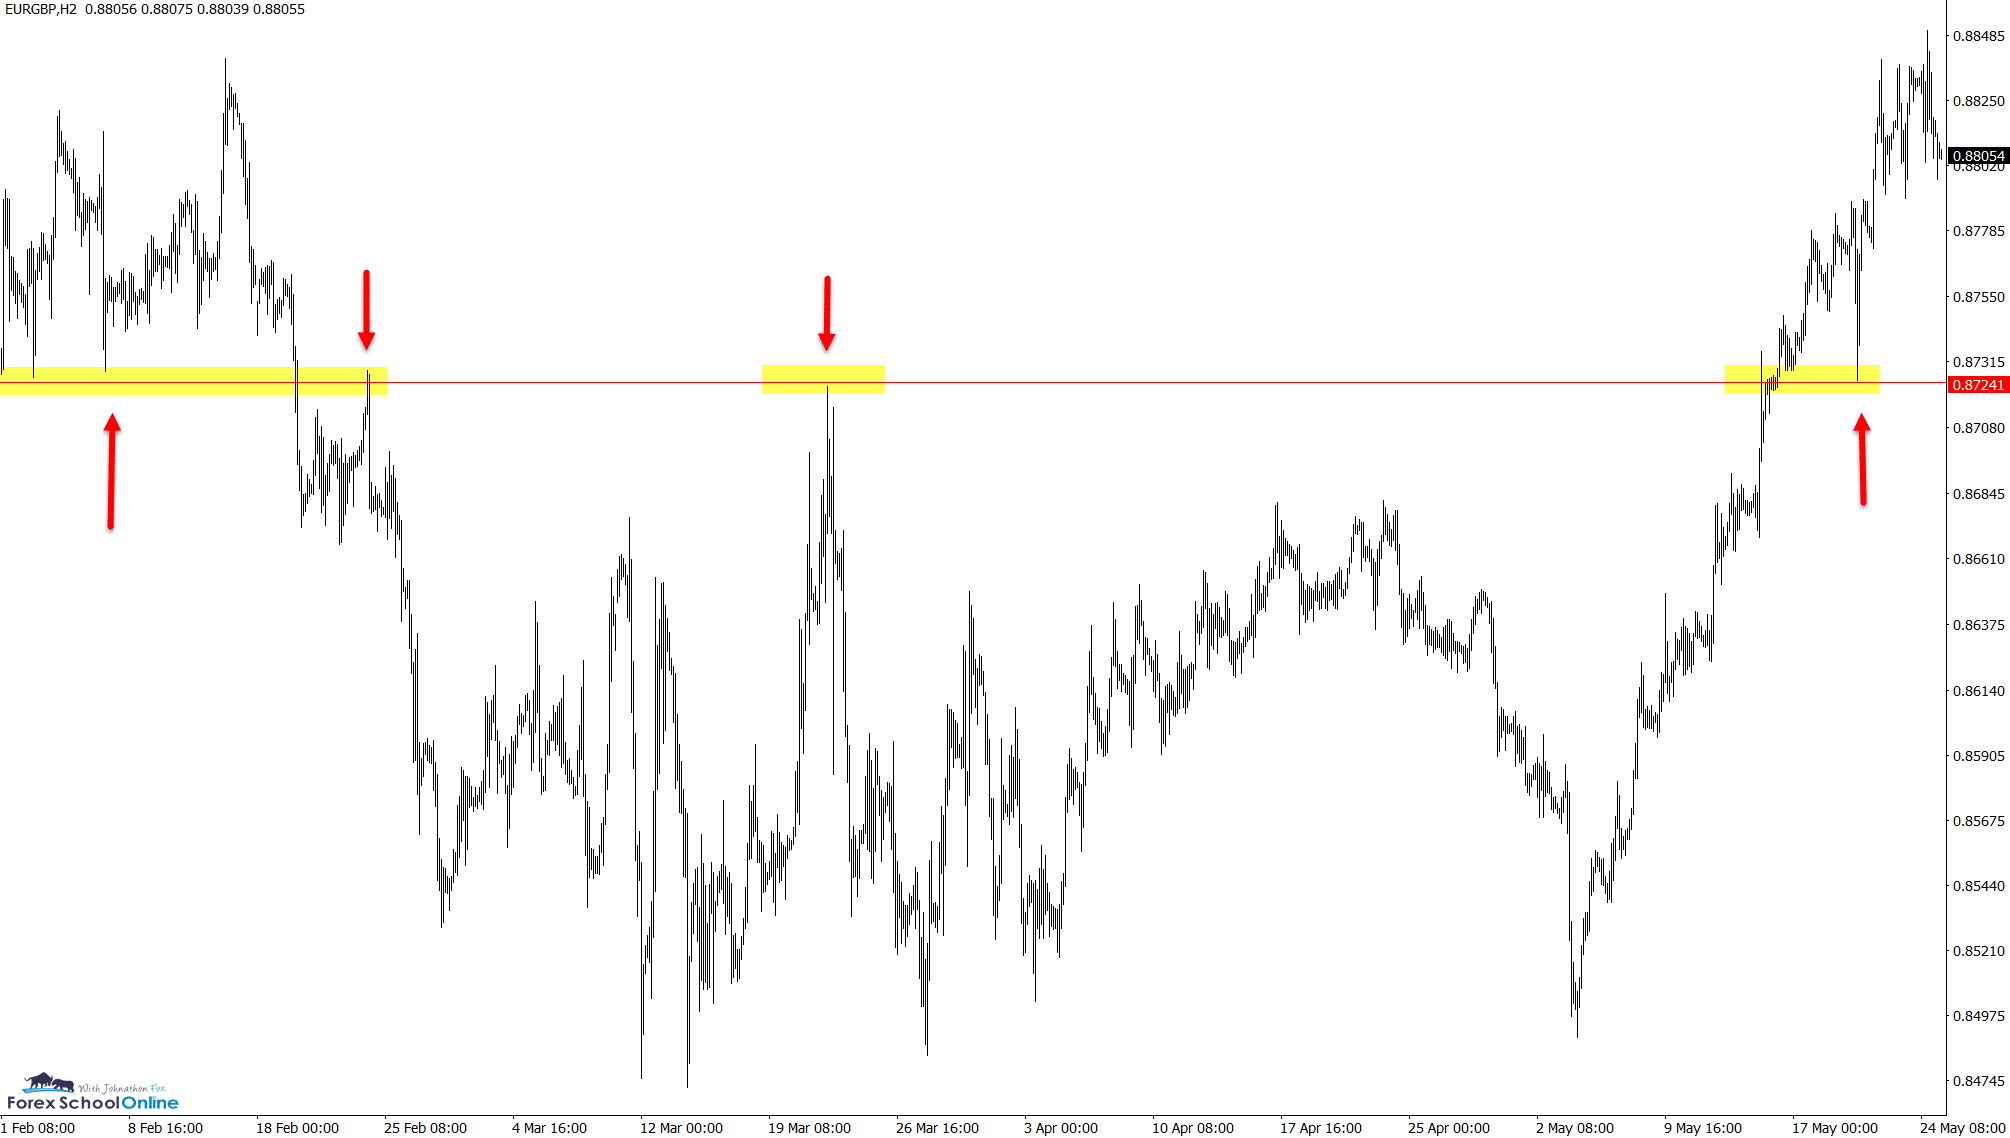
Charts in Focus Note: All views, discussions and posts in the ‘charts in focus’ are the view of Forex School Online and are not recommendations or trading advice. All posts are general in nature and are not advice to buy or sell.
Please leave questions or comments in the comments section below;



Thanks john for your wealth of information.
Much appreciated 👍
You’re welcome Steve 👍👍
Safe trading,
Johnathon