Weekly Price Action Trade Ideas – 25th to 29th Jan 2021
Markets Discussed in This Week’s Trade Ideas: USDCHF, GBPAUD, GOLD and AUS200.
Note: We Use Correct ‘New York Close 5 Day Charts’ – You can read about why we use these and how to download the correct free charts at Correct Free New York Close Demo Charts
USDCHF Daily Chart
-
Range Still in Play
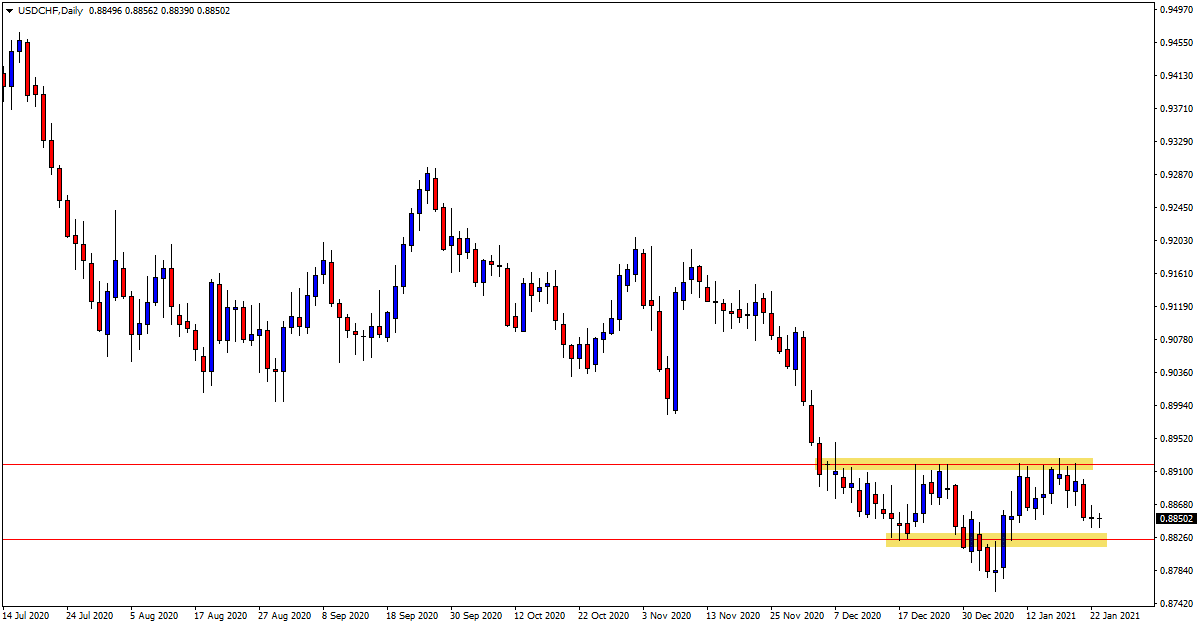
The ranging and sideways price action we recently discussed on this pair is still in play on the daily chart.
Whilst there is an overall trend lower in play, for as long as this range continues to hold we can keep looking to make both long and short trades.
Price is now looking to move into the range low and support area and this could be a good level to look for potential long trades on the intraday time frames such as the 4 hour chart and below.
Daily Chart

GBPAUD Daily Chart
-
Watching for Short Trades
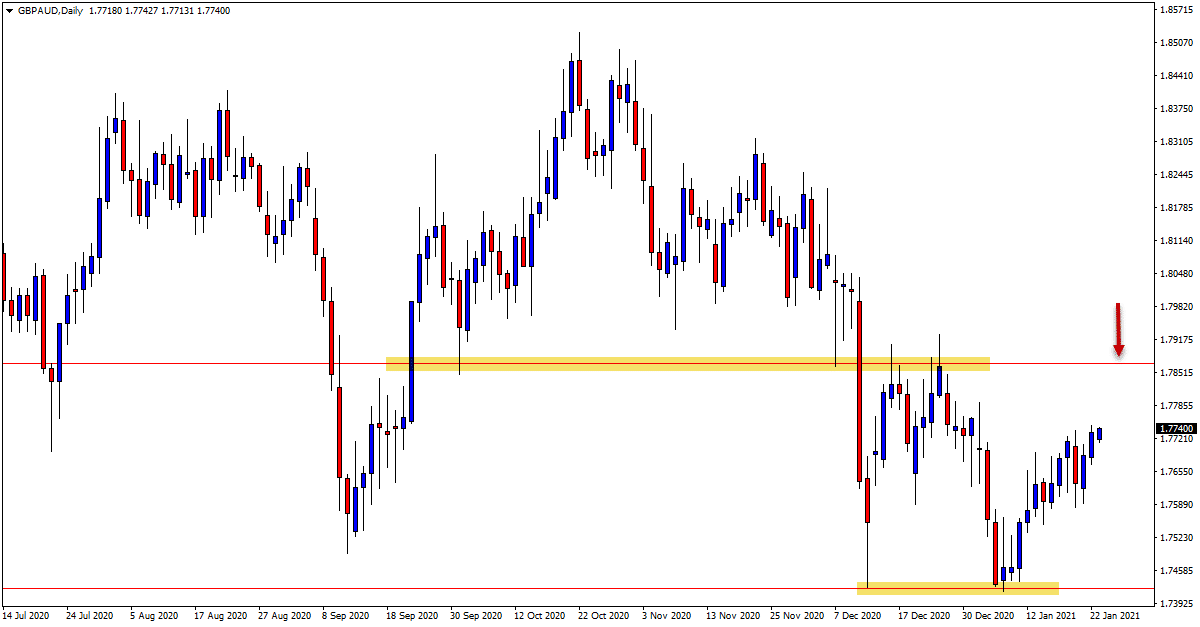
Whilst there is an overall range in play with this pair, there could be an opportunity to look for short trades in the coming sessions.
Recently we have seen price respect and bounce from the daily support level and it is now moving into the major resistance.
Because there is no clear trend in play, this resistance could be a solid level to start looking for new potential short trades.
Daily Chart

GOLD Daily Chart
-
Watching Both Sides of the Market
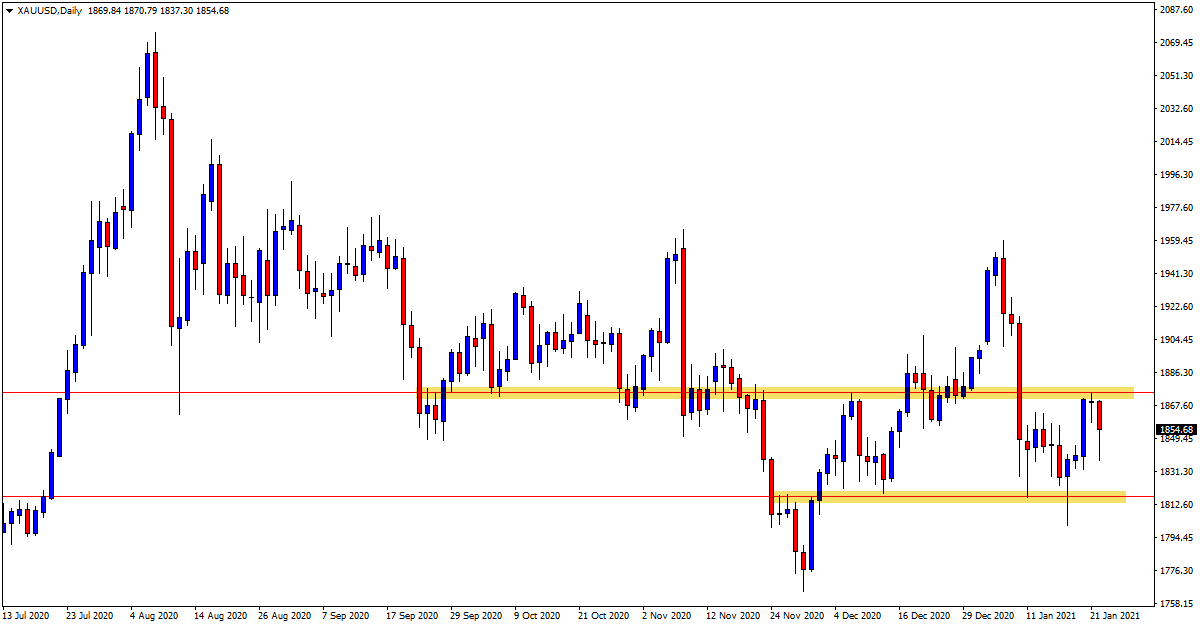
Those traders who have been trading Gold in recent months have most likely been left very frustrated.
Whilst we have seen some solid moves both higher and lower, we have also seen a lot of false breaks. Price overall has not really moved anywhere since the middle of last year.
The sideways range and congestion that we have been experiencing now for months looks set to continue until we get some clearer price action and either the bulls or bears can take control. That makes it a very tricky market to trade indeed.
Daily Chart

AUS200 Daily Chart
-
Can Price Flip Support Hold?
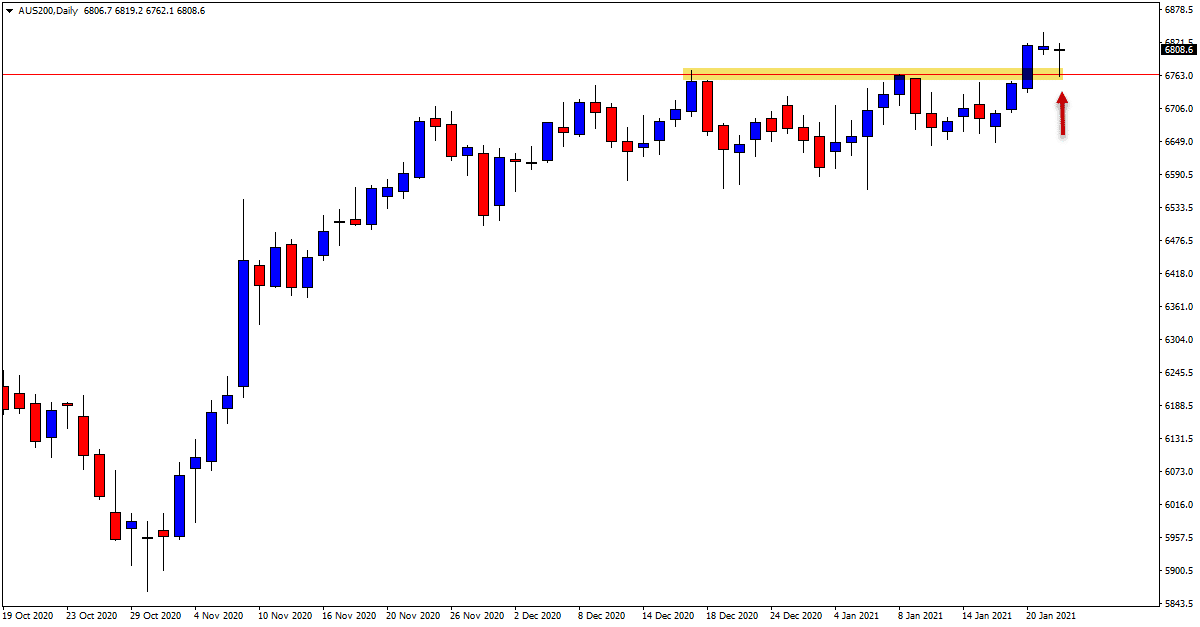
After the huge sell off lower into March last year, this market has been in a strong trend higher and has almost regained all of it’s losses.
In the shorter term we can see on the daily chart that price moved into a consolidation and sideways pattern. This has now been broken with price breaking higher.
Price is now looking to test the old consolidation resistance to see if it will hold as a new price flip level. If this level holds we could see a new extended leg higher with multiple long trading opportunities.
Daily Chart

Trade Ideas Note: All views, discussions and posts in the ‘charts in focus trade ideas’ are the view of Forex School Online and are not recommendations or trading advice. All posts are general in nature and are not advice to buy or sell.
Note: We Use Correct ‘New York Close 5 Day Charts’ – You can read about why we use these and how to download the correct free charts at Correct Free New York Close Demo Charts
Please leave questions or comments in the comments section below;


Leave a Reply