Weekly Price Action Trade Ideas – 22nd to 26th of July
Markets Discussed in This Week’s Trade Ideas: NZDUSD, EURNZD, GBPCHF and EURCAD.
Note: We Use Correct ‘New York Close 5 Day Charts’ – You can read about why we use these and how to download the correct free charts at Correct Free New York Close Demo Charts
NZDUSD Daily Chart
Potential Long Trades on Weakness
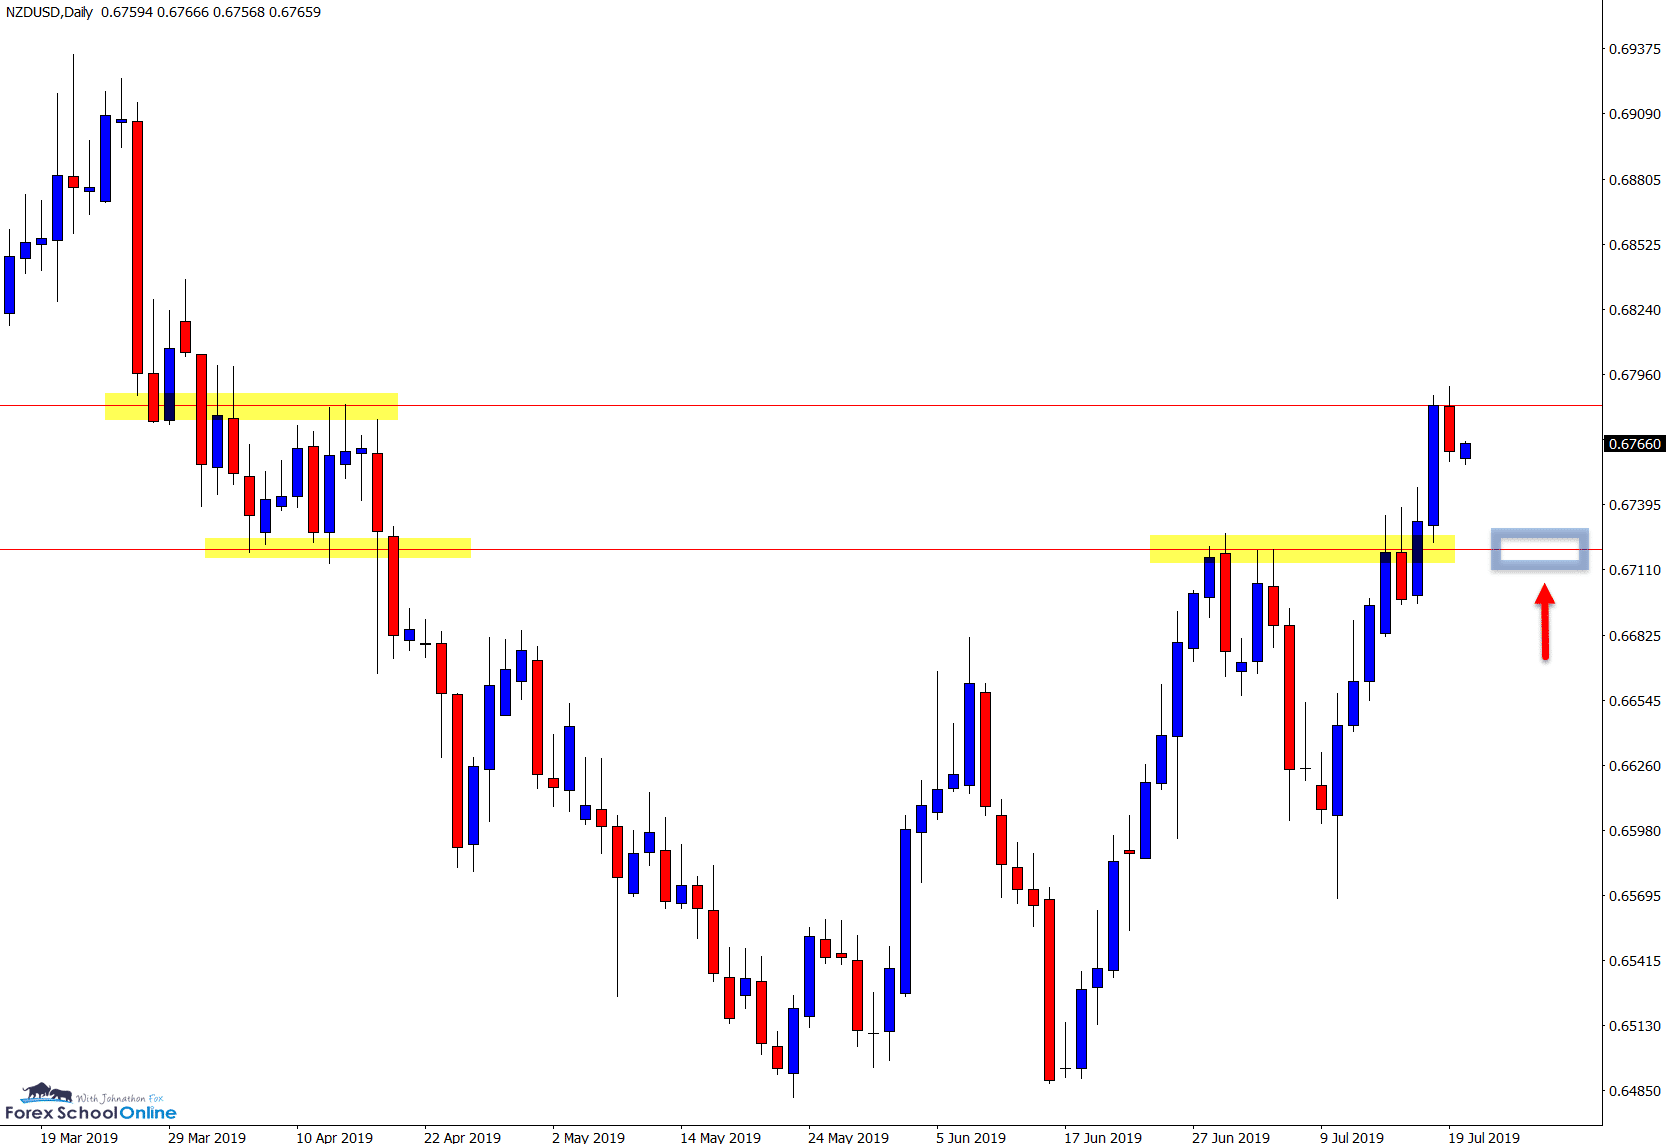
Price action on the daily NZDUSD has in recent times pushed higher with a 123 pattern.
After taking out the recent swing resistance, price pushed higher and has now paused.
As the daily chart shows below; price is testing the current daily resistance level after the aggressive move higher.
If price can rotate lower it could open the door for possible long trades at the old resistance and new support inline with the current strong push higher.
Daily Chart
EURCAD Weekly and Daily Charts
Pin Bar Sends Price Into Support
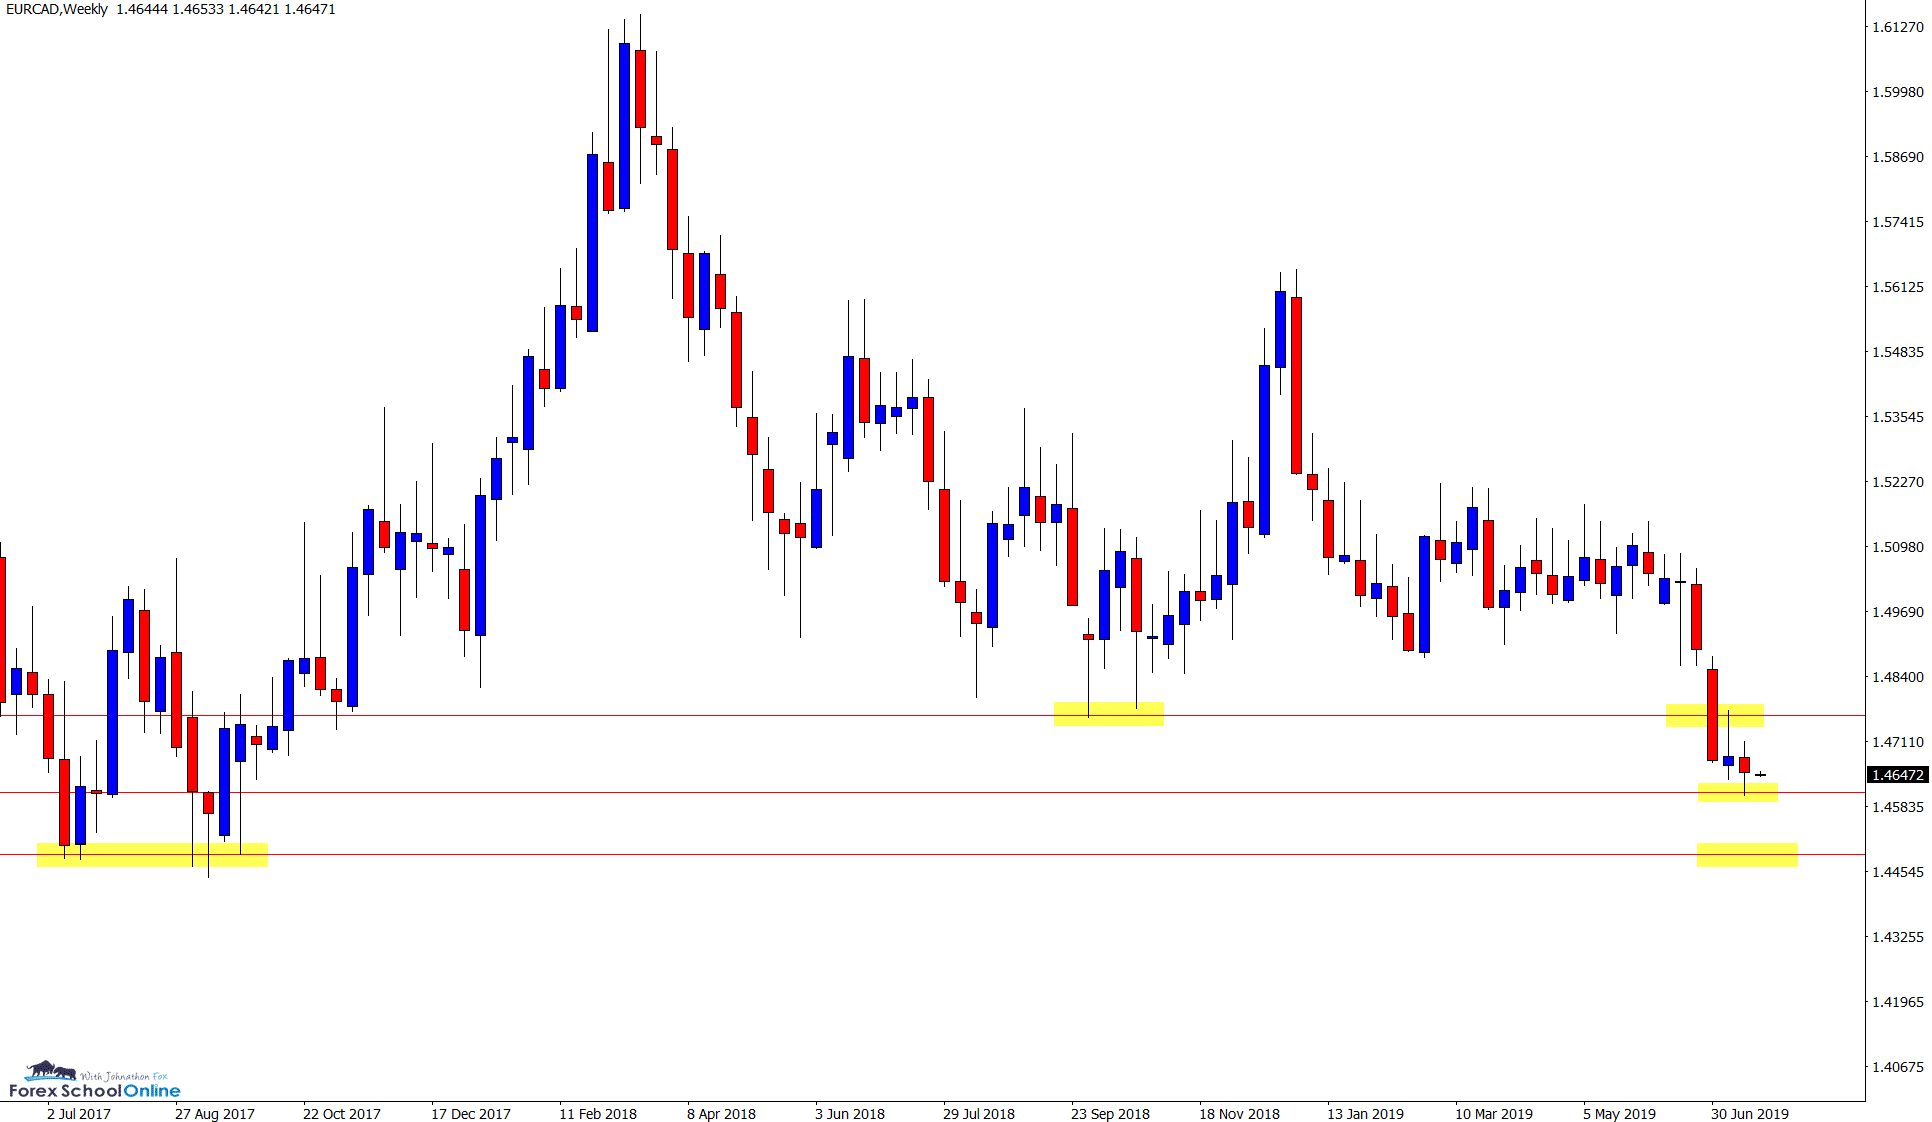
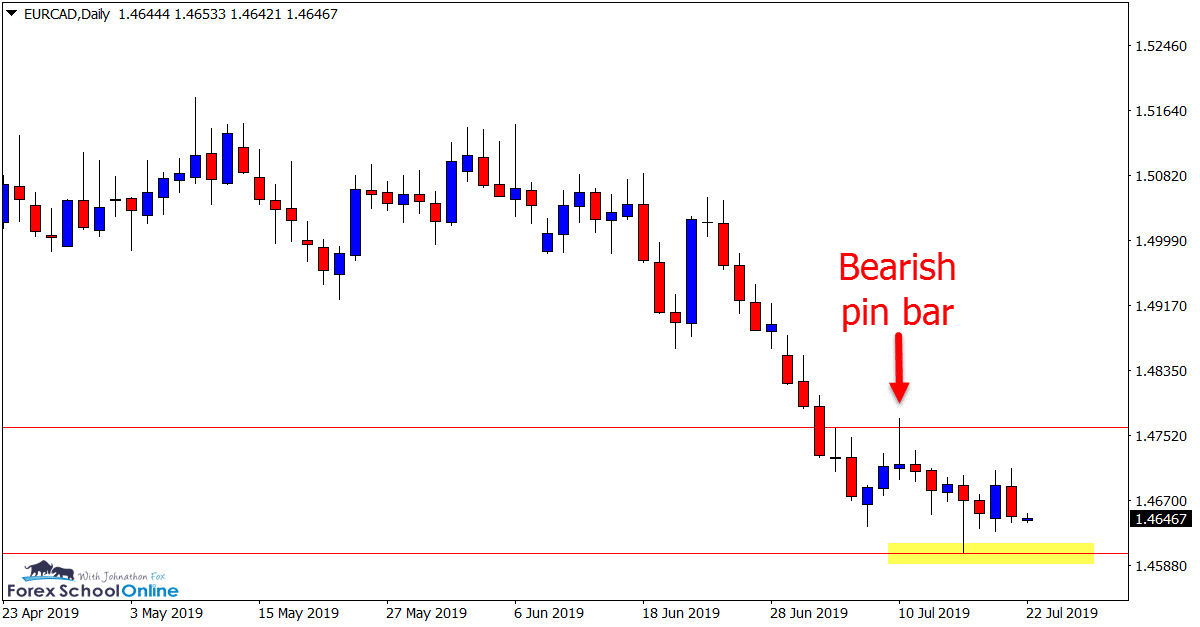
In our recent trade ideas on the 10th of July we looked at the EURCAD aggressive break lower and potential retrace points.
Price has since made a quick retrace higher and formed a bearish pin bar.
After price broke lower and below the pin bar it moved into the important daily support level and has since consolidated.
For price to continue on the move lower this support will need to give way. If this can happen, then there looks to be more space to the downside.
Weekly Chart
Daily Chart
EURNZD Daily Chart
Old Support Could Act as New Flip Resistance
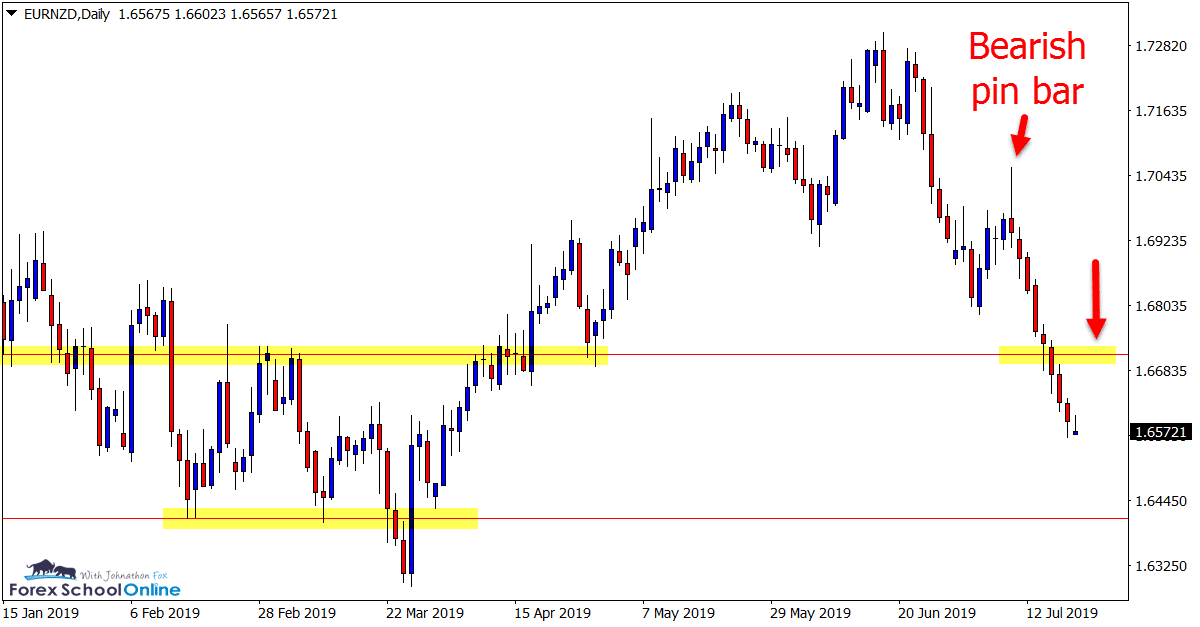
After price formed a large bearish pin bar on the daily chart of this market, price sold off heavily.
Since the pin bar we have seen eight consecutive trading days lower.
If price can rotate back higher and back into a swing high it could present a possible chance to look for short trades.
All of the short-term momentum is lower and if price can rotate back into the old support level we could watch to see if it holds as a new resistance for potential A+ trade setups.
Daily Chart
GBPCHF Daily and 4 Hour Charts
Consolidating After Large Move Lower
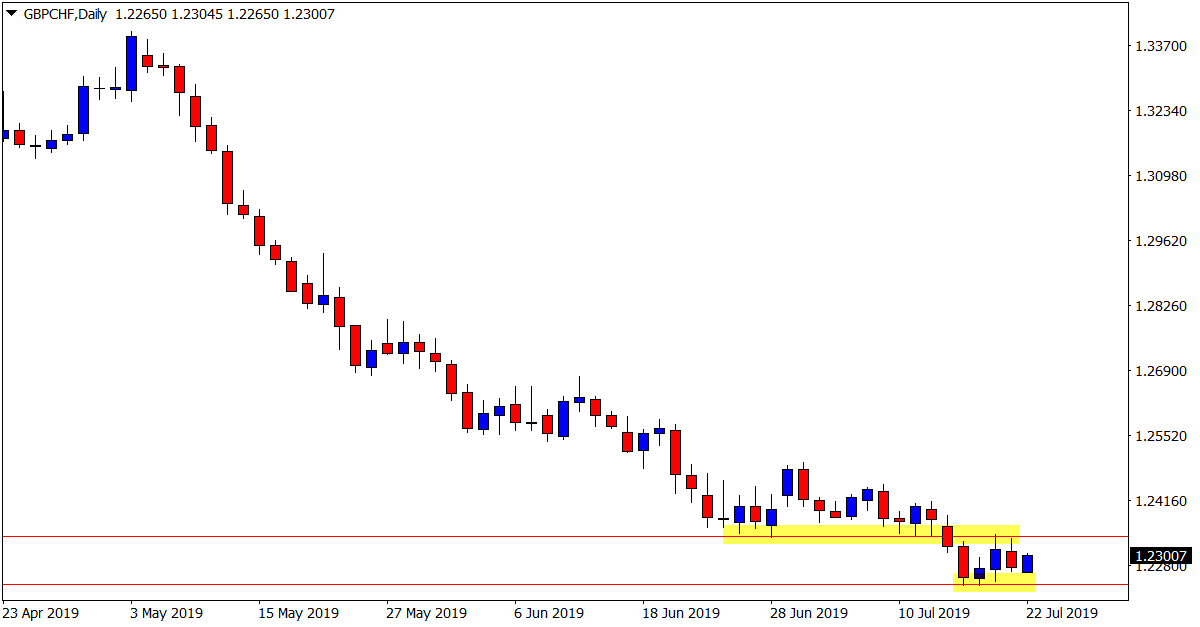
On the 17th of June trade ideas we discussed this market and a price action pattern that is similar to what presents now.
In that trade ideas we discussed how price had sold off lower, consolidated in a sideways box, before again breaking lower.
Price has since repeated this pattern with heavy sell-offs and once again moving into a consolidation pattern.
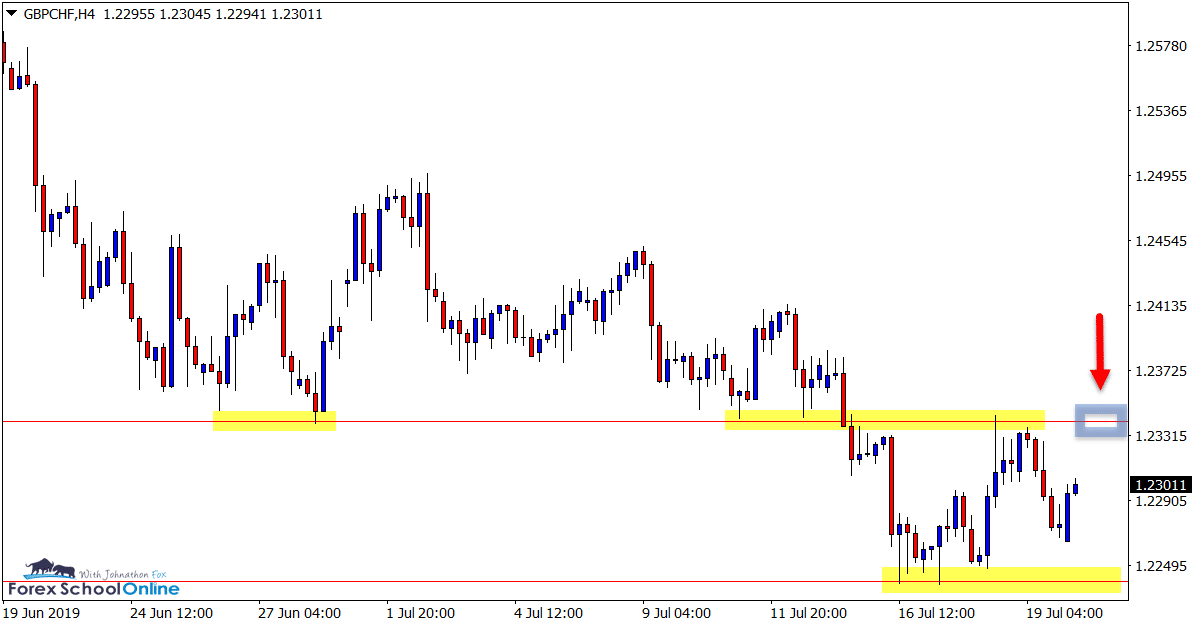
If price does move higher and into the recent old support area we could watch intraday charts such as the 4 hour chart for potential A+ bearish price action trades.
Aggressive traders could also watch to see if price continues with this move with possible breakout trades lower and through the current consolidation box.
Daily Chart
4 Hour Chart
Trade Ideas Note: All views, discussions and posts in the ‘charts in focus’ are the view of Forex School Online and are not recommendations or trading advice. All posts are general in nature and are not advice to buy or sell.
Please leave questions or comments in the comments section below;


Leave a Reply