Weekly Price Action Trade Ideas – 17th to 21st August 2020
Markets Discussed in This Week’s Trade Ideas: GBPUSD, EURUSD, CADJPY and GOLD.
Note: We Use Correct ‘New York Close 5 Day Charts’ – You can read about why we use these and how to download the correct free charts at Correct Free New York Close Demo Charts
GBPUSD Daily Chart
Price Action Consolidating Below Resistance
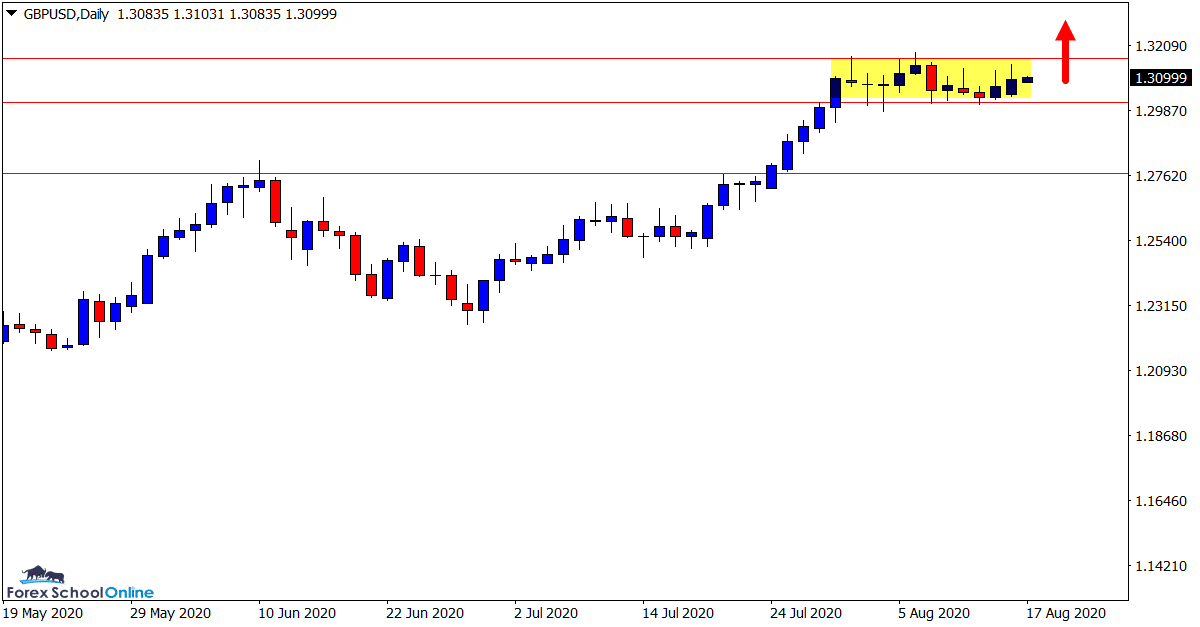
After making a solid trend higher on the daily chart, this market has stalled in recent sessions.
As the daily chart highlights; price has not been able to break higher and is stuck in a sideways box pattern.
Because this sideways box is so constricted, the best play could be to look and wait for a breakout. When the breakout does occur we could then look for breakout trades on both the higher and smaller time frames.
Daily Chart

EURUSD 4 Hour Chart
Intraday Price Flip Support Level Holding
Price in this market has been holding at the intraday support level.
As the 4 hour chart shows; price has recently broken above this level and it has since held as a new support.
The next overhead resistance level that could soon come into play looks a key level. The last two times price has tested this level we have seen bearish engulfing bars with price selling off lower.
4 Hour Chart

CADJPY Daily Chart
Next Key Support Level Coming Into Play
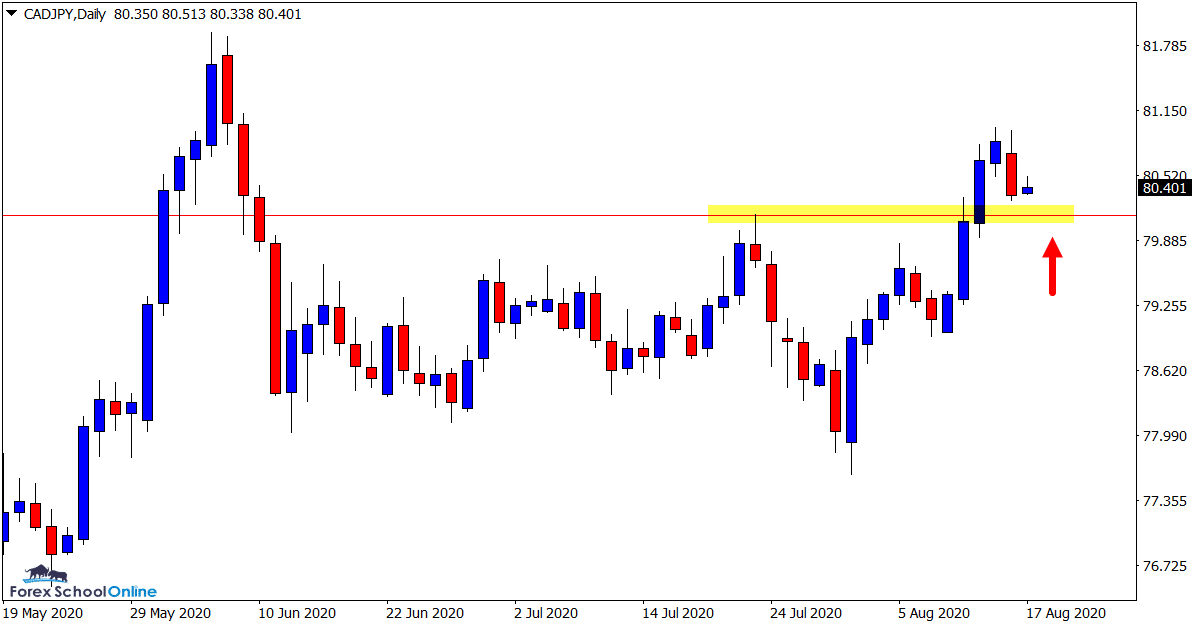
After making a strong breakout higher and through the swing high resistance, price is now rotating lower back into this same level.
If this old resistance can hold as a new price flip support level it could be a solid level to hunt long trades with solid bullish price action.
Bullish price action could be watched for on the higher time frames like the daily chart and the smaller intraday charts like the 1 hour time frame.
Daily Chart

GOLD Daily Chart
Daily Inside Bar
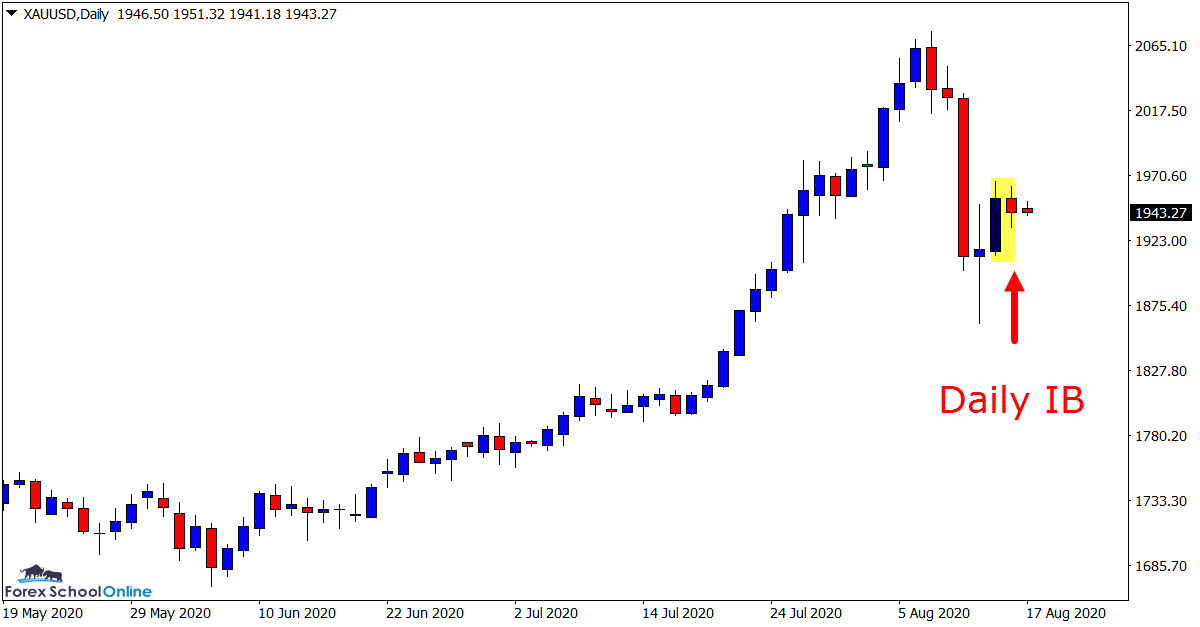
This is a market we have been charting and keeping a close eye on in recent times. A major reason for that is because of the strong trend price has been making higher.
Price has now made a substantial pullback lower on the higher time frames. As the daily chart shows; we have an inside bar that has formed after this strong pullback.
For the strong momentum and trend to continue we will need to see this inside bar break back higher which could then lead to the recent highs being re-tested.
A break lower and the recent daily chart swing low would come into focus.
Daily Chart

Trade Ideas Note: All views, discussions and posts in the ‘charts in focus trade ideas’ are the view of Forex School Online and are not recommendations or trading advice. All posts are general in nature and are not advice to buy or sell.
Note: We Use Correct ‘New York Close 5 Day Charts’ – You can read about why we use these and how to download the correct free charts at Correct Free New York Close Demo Charts
Please leave questions or comments in the comments section below;


its great thank lot