Weekly Price Action Trade Ideas – 13th to 18th Oct 2019
Markets Discussed in This Week’s Trade Ideas: GBPUSD, USDJPY, AUDUSD and EURGBP.
Note: We Use Correct ‘New York Close 5 Day Charts’ – You can read about why we use these and how to download the correct free charts at Correct Free New York Close Demo Charts
GBPUSD Daily Chart
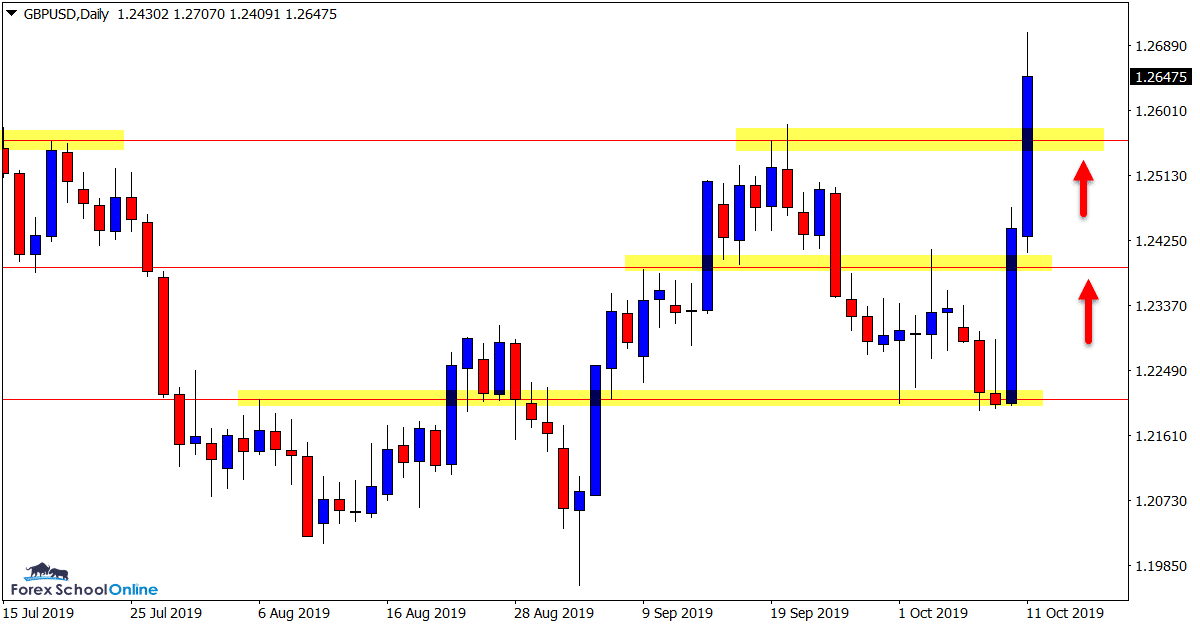
Breakout of Box
In last week’s trade ideas we were looking to see if this market could give a little more indication to what it wanted to do before looking to make trades.
Price had formed two inside bars showing the state of indecision. We could also see price was sitting between very close daily support and resistance levels.
During the week price moved lower to attempt to breakthrough the support level before trickling just past the lows and snapping back higher. We will often see this at key levels with price trickling just above or below before snapping back in the other direction.
You will often see it in your own trades. For example; if playing a pin bar, price will often go just above the high or low of a pin bar, stop you out and then reverse again.
Price has now made the aggressive break higher. The following sessions will be a good watch to see if price can rotate back into old resistance and new flip support and potentially continue the move higher.
Daily Chart

USDJPY Daily Chart
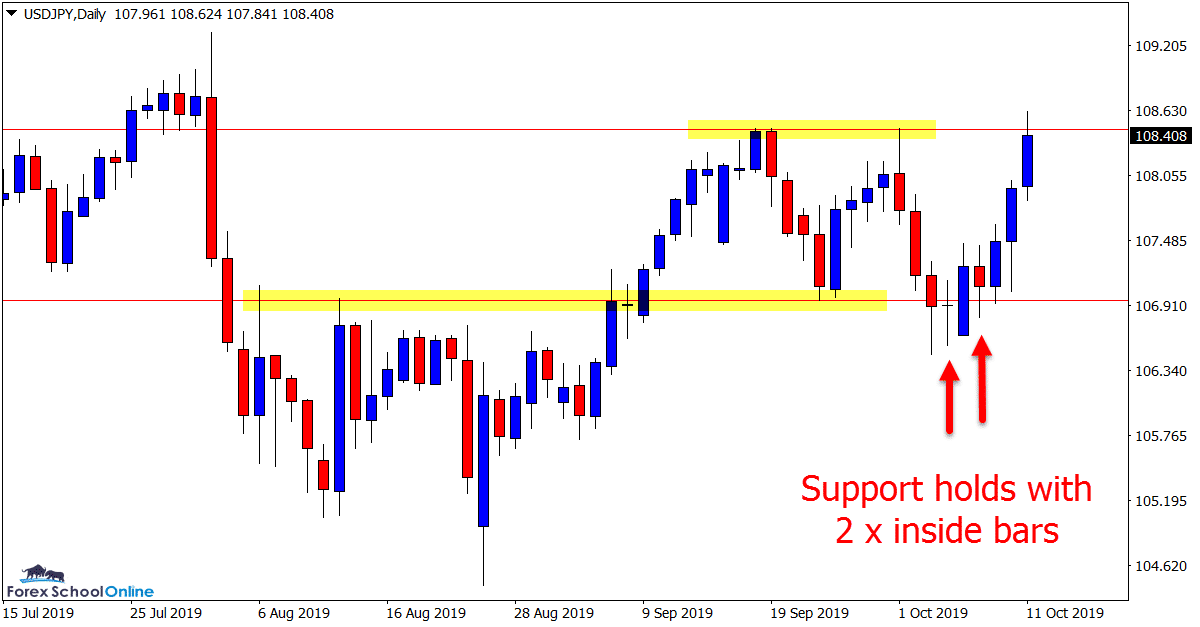
Two Inside Bars at Support
In last week’s trade ideas we discussed the range of support zones that price was looking to test in the week ahead.
Price had formed an inside bar on the daily chart showing indecision and there were multiple support ‘zones’ for price to try to break through.
Price has since formed a second inside bar and moved back into the same resistance where we saw the last Bearish Engulfing Bar – BEEB form.
This has been an aggressive move higher and the market open and early sessions will be crucial.
If price can breakthrough this level we could see potential breakout and breakout and retest trades into the 109.00 area.
Daily Chart

AUDUSD Daily Chart
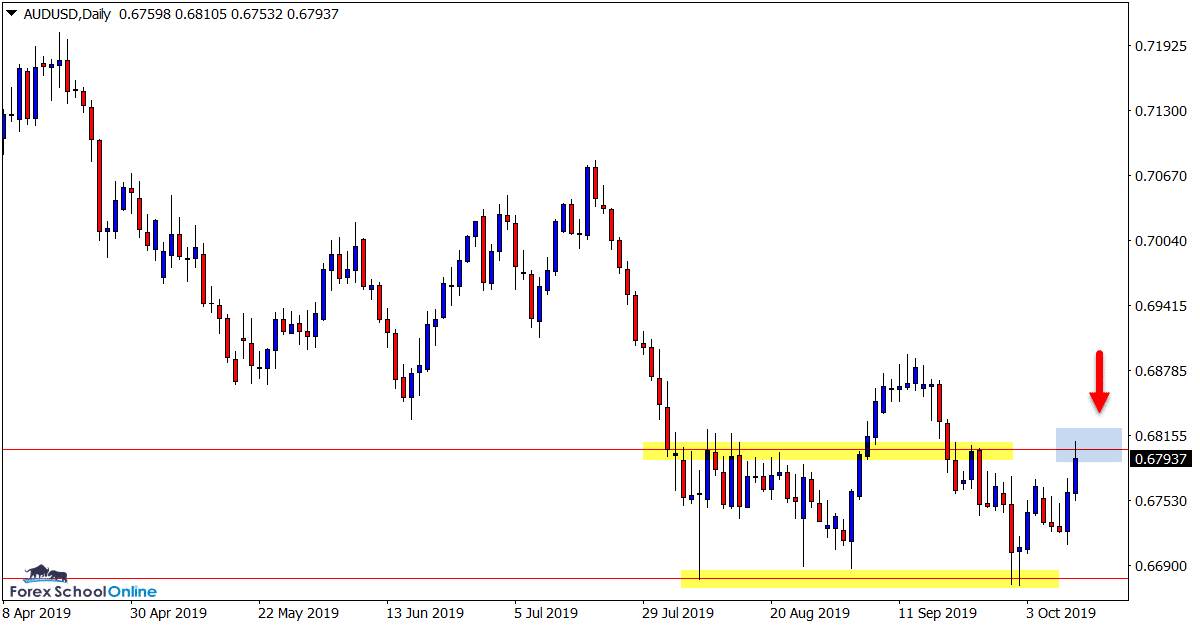
Important Test of Resistance
Price on the Aussie has now bounced higher and into the key daily resistance level.
As we discussed recently, this market has been steadily getting sold off for an extended period to recently be trading down at ten year lows. In the short-term however; the support level has held up on multiple occasions and rebounded price each time.
Until price makes a sustained break above the daily resistance, bearish traders could still hunt trades if price fires off high quality trade setups to get short at the major daily resistance.
Daily Chart

EURGBP Daily Chart
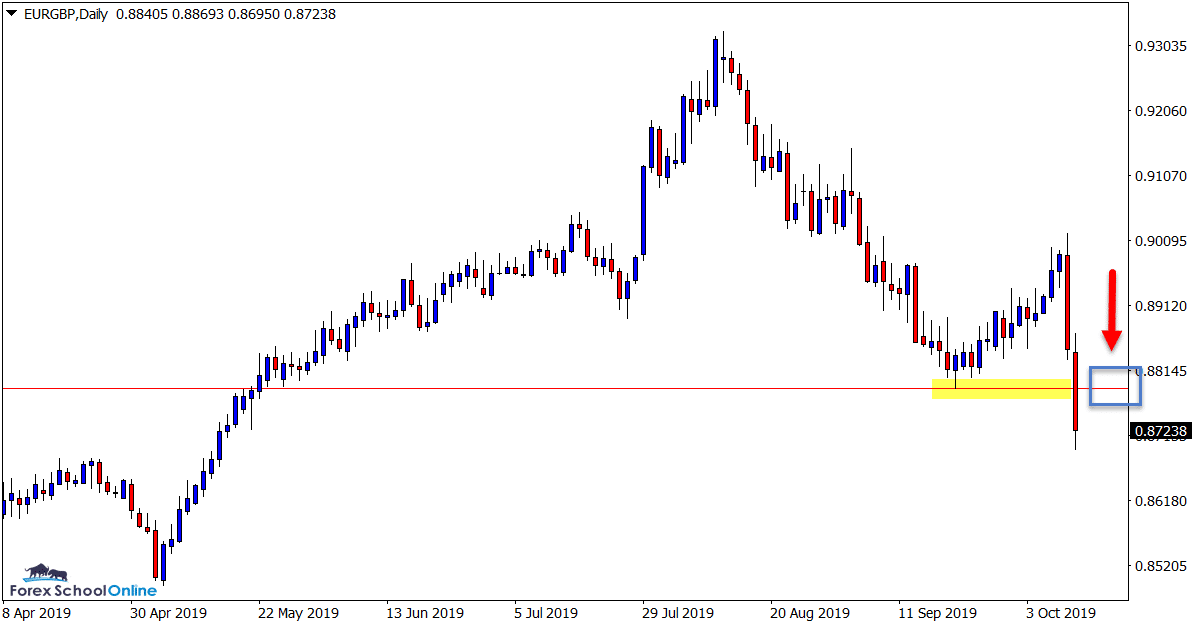
Weekly and Daily Engulfing Bars
An interesting market that has produced a large move in the last two daily sessions.
With this huge sell off price has formed both a weekly engulfing bar and recent daily chart engulfing bar.
With the weekly engulfing bar being at a swing low and the daily setup already passed, bearish traders looking to get into this market could watch to see if price rotates back into the overhead resistance level.
If this level acts as an old support and new resistance it could be a solid area to hunt A+ trades with the recent momentum on the daily and smaller time frames.
Daily Chart

Trade Ideas Note: All views, discussions and posts in the ‘charts in focus trade ideas’ are the view of Forex School Online and are not recommendations or trading advice. All posts are general in nature and are not advice to buy or sell.
Note: We Use Correct ‘New York Close 5 Day Charts’ – You can read about why we use these and how to download the correct free charts at Correct Free New York Close Demo Charts
Please leave questions or comments in the comments section below;


Thank you very much sir for this information.
Hi Samuel,
thanks for comment and nice to have you!
Johnathon