Weekly Price Action Trade Ideas – 12th to 16th of August
Markets Discussed in This Week’s Trade Ideas: EURUSD, GBPAUD, GBPCAD and CHFJPY.
Note: We Use Correct ‘New York Close 5 Day Charts’ – You can read about why we use these and how to download the correct free charts at Correct Free New York Close Demo Charts
EURUSD Daily Chart
Not Much Happening With Price Action
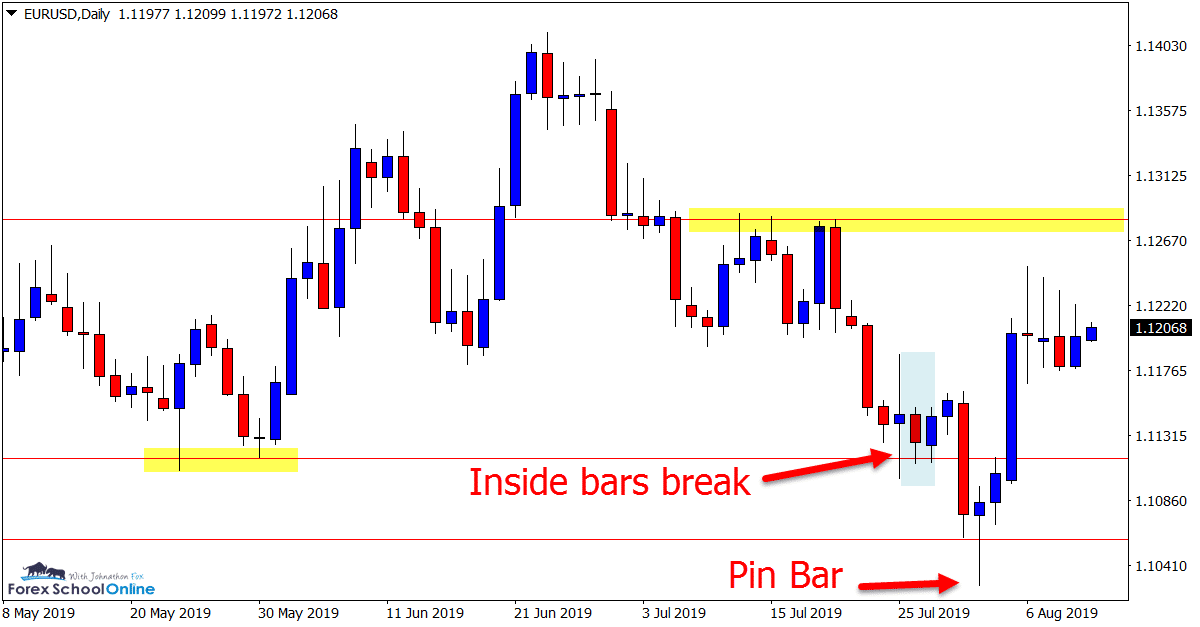
Price action on the EURUSD daily chart is in pedestrian mode at the moment. We have formed more inside bars on the daily chart, but this is quite common when price is not going anywhere and is chopping back and forth.
In our last commentary we discussed the inside bars and the possibility for a break lower. Whilst price did break and move directly into the next support, it did not open the way for any free flowing price action and the sideways range has resumed.
This is not a market I am watching particularly closely just at the minute as price is just meandering along sideways. By all means; it is not wrong to look for trades, I am just personally watching other markets more closely.
Daily Chart
CHFJPY Daily Chart
Can Price Break Lower?
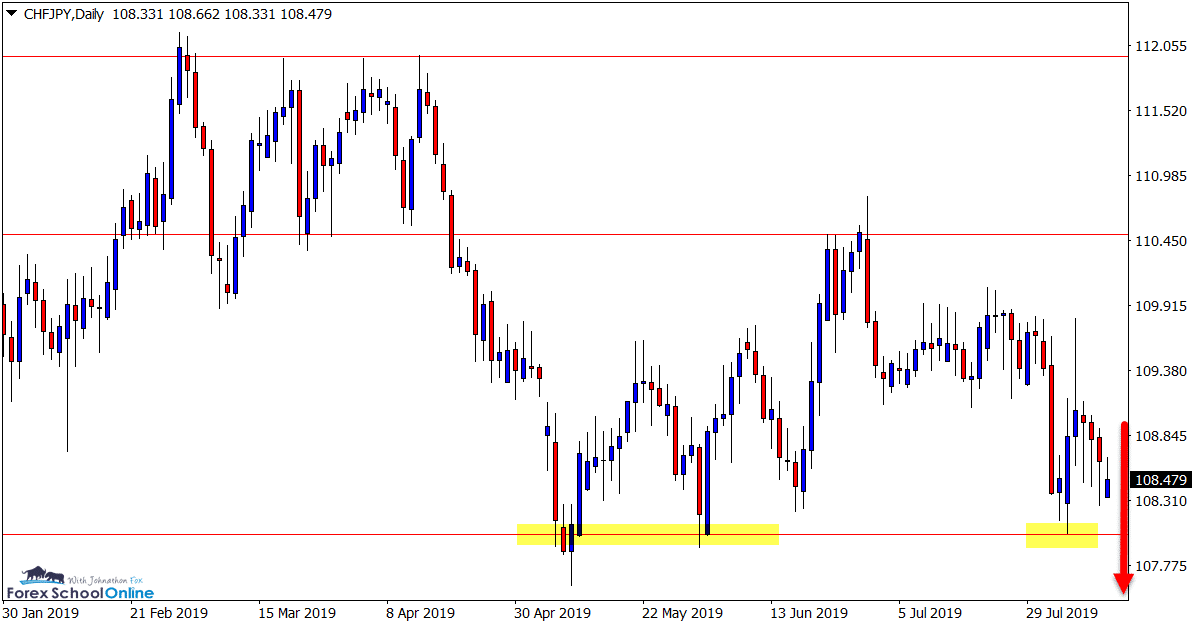
This is another market stuck in a sideways range with fairly clear levels.
The support level is a solid level that has been respected on multiple occasions, but the last rejection was fairly weak.
If this level can give way it could open the door for an aggressive move lower with potential short trades including breakouts and breakout and quick retest setups.
Daily Chart
GBPAUD Daily and 4 Hour Charts
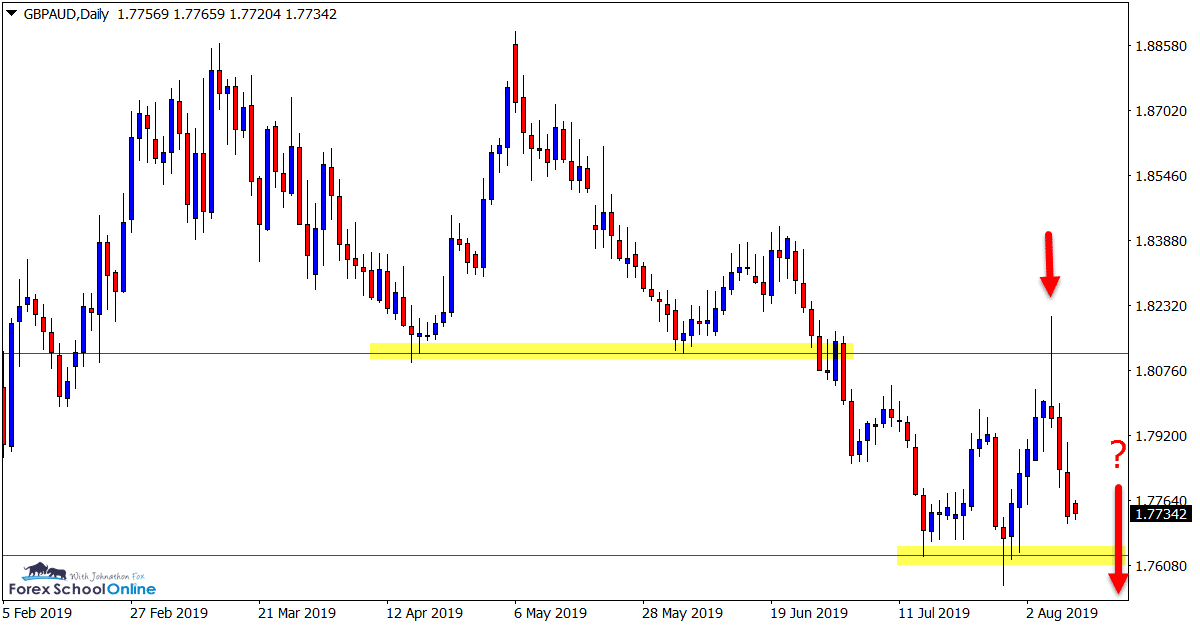
False Break Sends Price Into Support
Whilst there is no clear trend just at the moment on the GBPAUD, price is still making decent moves and respecting its major levels.
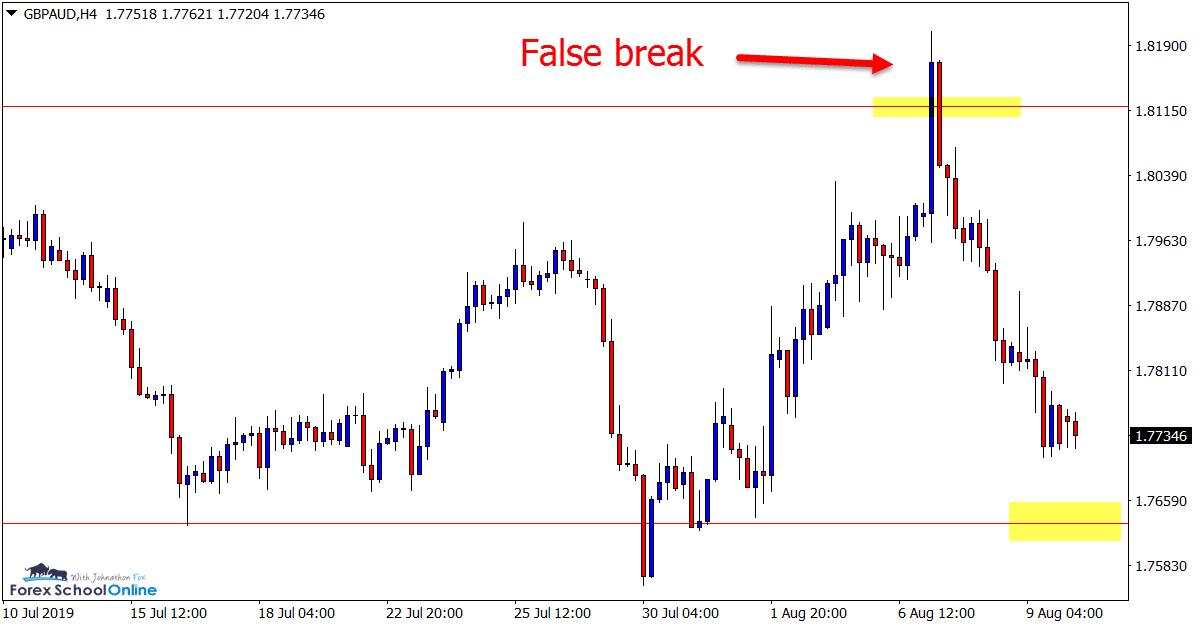
As we can see on the charts below; price recently popped higher and created a large false break to sell off lower.
Price is now rotating into the support level. This could present with multiple potential setups, keeping in mind that price is not in a strong trend in either direction.
If the bulls hold at the support, then trades similar to the bearish false break could be hunted looking for a potential A+ bullish false break.
If price breaks lower, then it could quickly gain steam and open possible short trades.
Daily Chart
4 Hour Chart
GBPCAD Daily and 4 Hour Charts
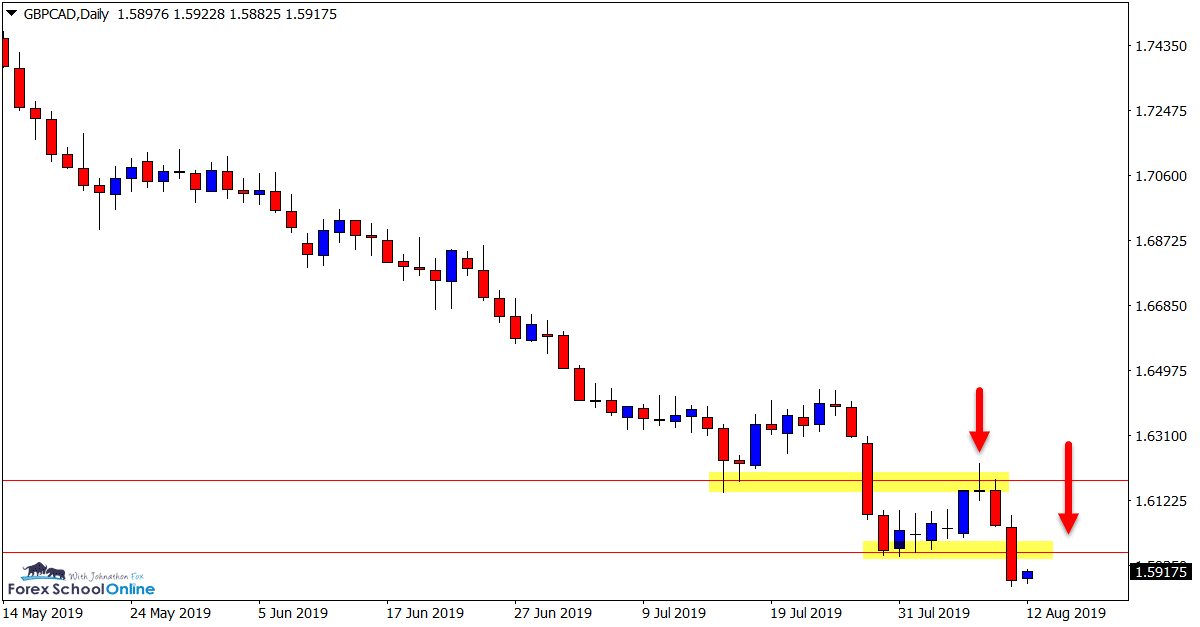
Price Action Stepping Lower
Like many GBP pairs, the GBPCAD has been trending lower in an obvious move.
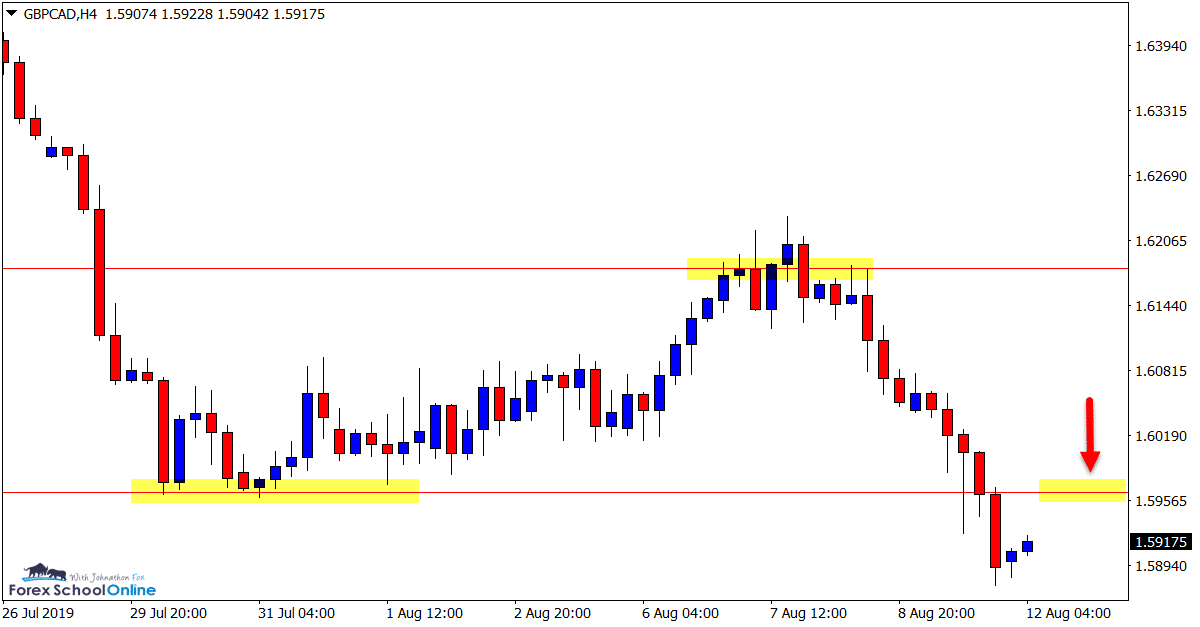
As the daily chart shows below; price is ‘stepping’ lower with lower highs and lower lows.
This has the potential to repeat with price looking to step lower once again. Price action traders could watch the recent support level to see if it holds as a new resistance for the next leg lower.
Daily Chart
4 Hour Chart
Trade Ideas Note: All views, discussions and posts in the ‘charts in focus’ are the view of Forex School Online and are not recommendations or trading advice. All posts are general in nature and are not advice to buy or sell.
Please leave questions or comments in the comments section below;


Leave a Reply