Weekly Price Action Trade Ideas – 10th July
Markets Discussed in This Week’s Trade Ideas: EURCAD, CHFJPY, AUDCAD and GBPAUD.
EURCAD Daily Chart
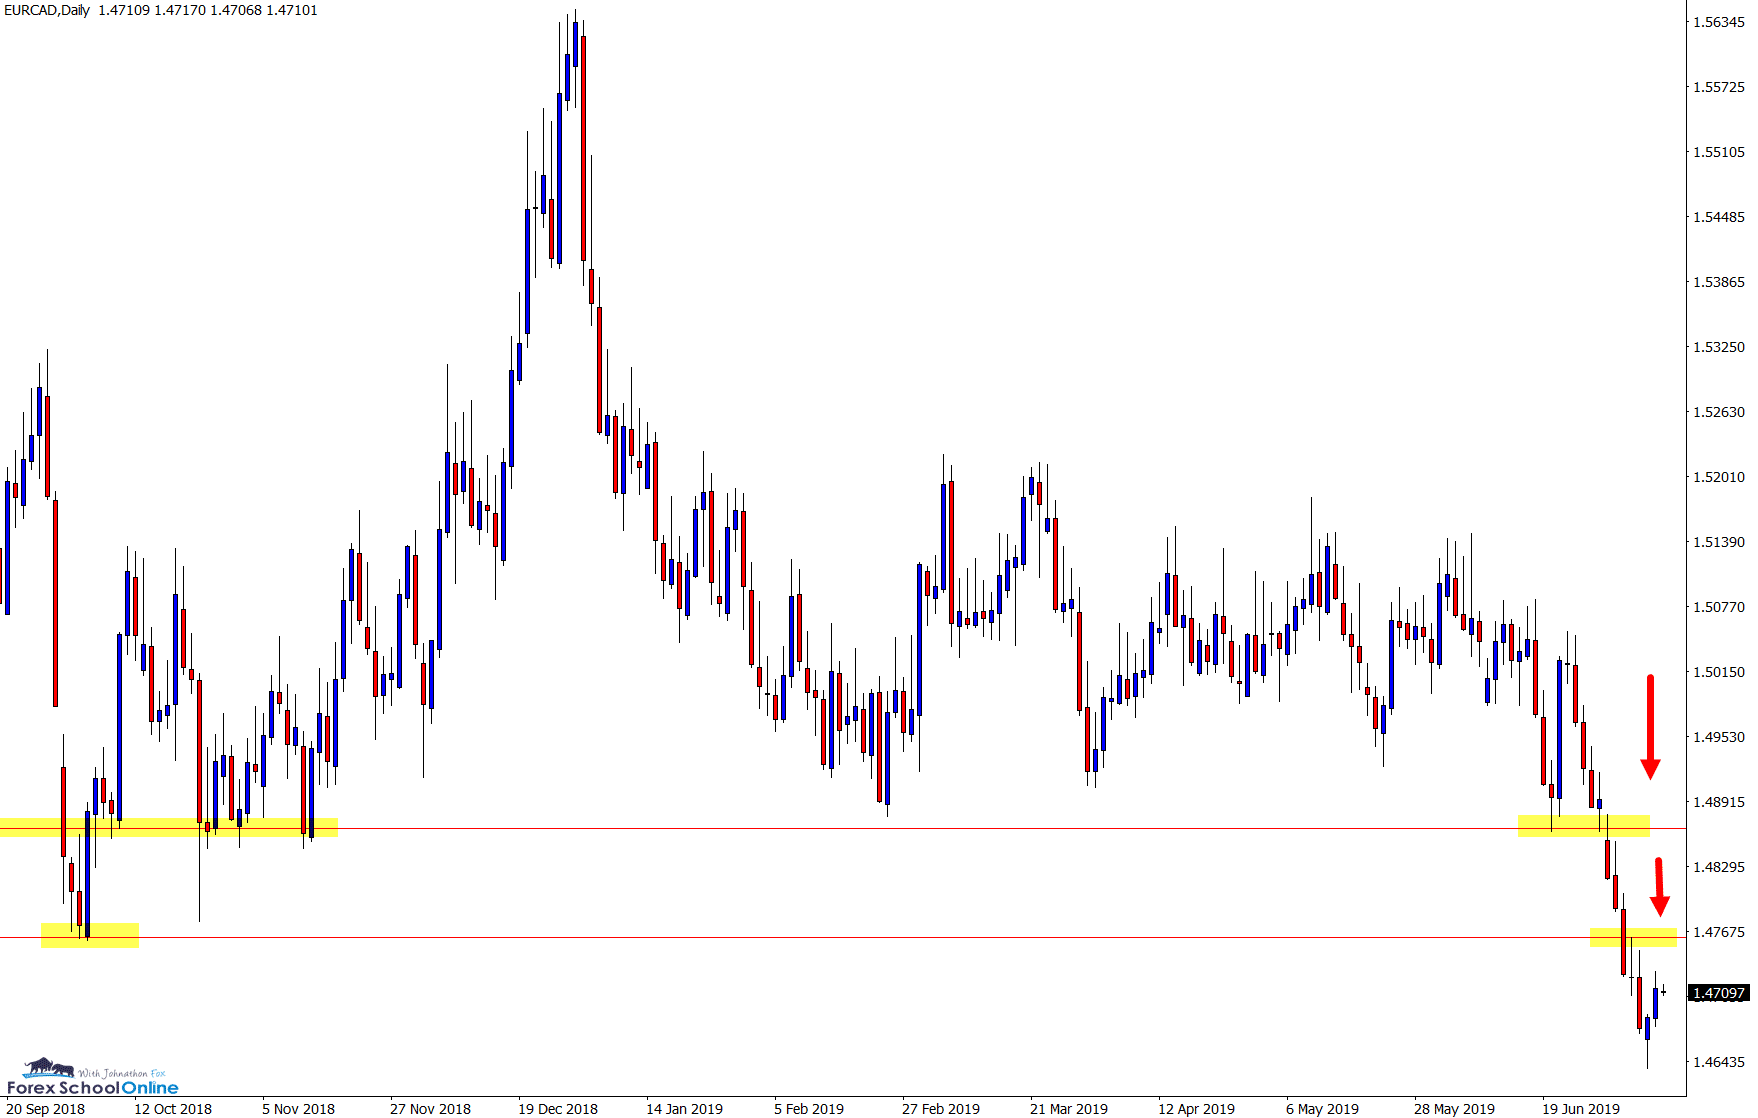
Major Sideways Range Breaks Aggressively
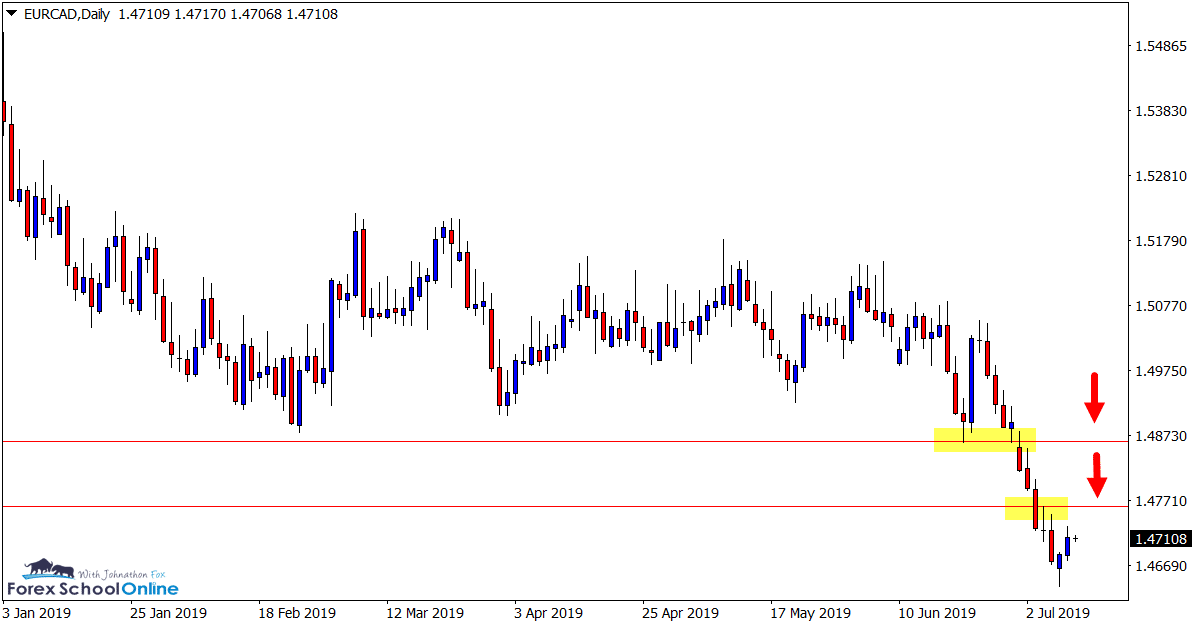
Price on the daily chart of the EURCAD has finally broken out and lower through it’s sideways range.
In the recent June 3rd trade ideas we were watching this market and it’s range highs and lows waiting for a break in either direction.
Markets that are in choppy and tight box consolidation periods can be very tricky to play, but when they break they can often offer a lot of trading opportunities. They can also often break fast and aggressively.
If price can now rotate back higher we could watch for bearish price action triggers inline with the breakout and recent momentum lower.
Daily Chart
Daily Chart
CHFJPY Daily and 4 Hour Charts
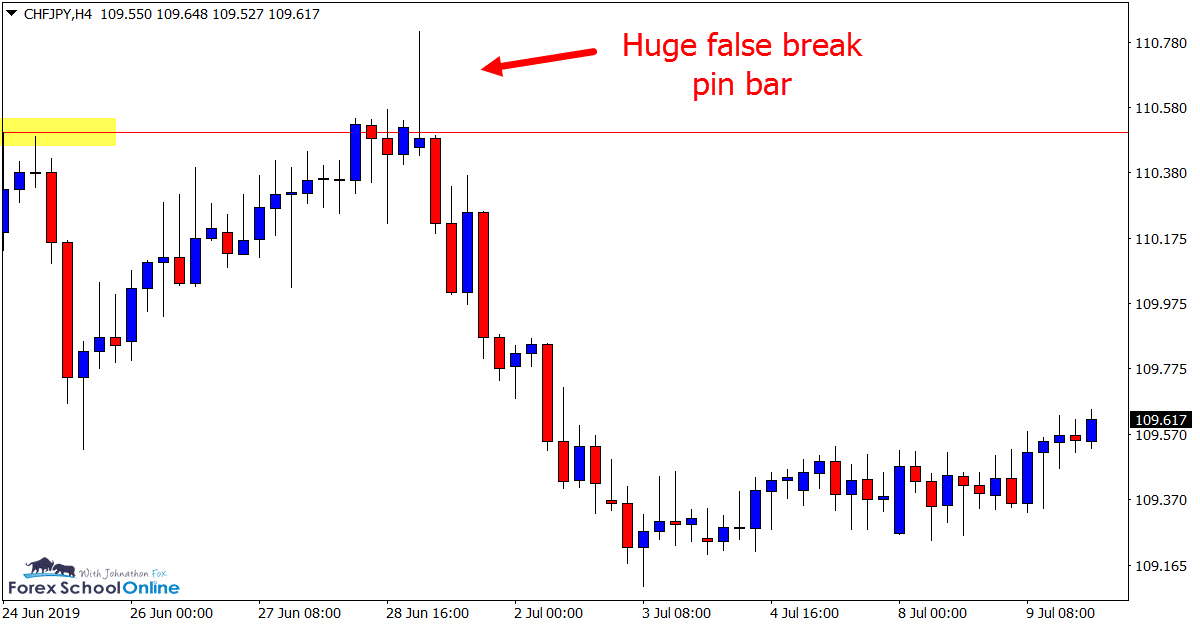
Huge False Break Pin Bar
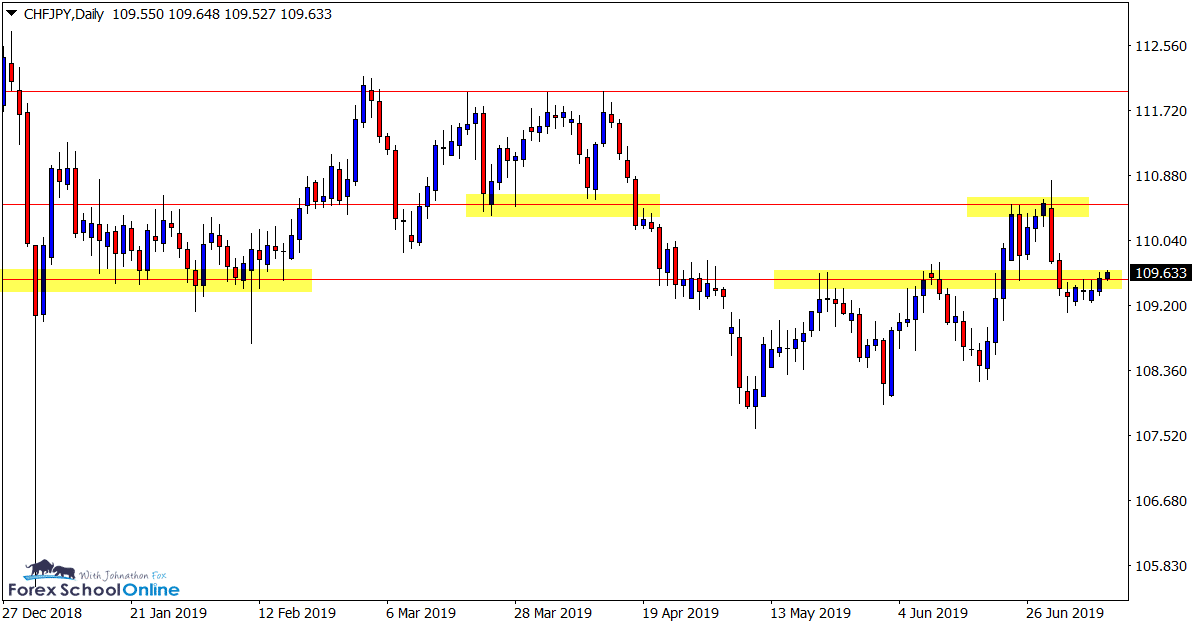
In last week’s trade ideas we were looking at this market and the strong daily resistance price was about to test.
Price in recent times has been creeping higher with higher lows, but this daily resistance held in emphatic fashion with a large false break 4 hour chart pin bar.
As you can see on the chart below; the false break sent price lower with large aggressive candles. Since then we have only crept higher with a series of small consolidation candles.
Until I see a further test of the resistance or a break lower I am personally happy to watch this market.
Daily Chart
4 Hour Chart
AUDCAD Daily Chart
Price Holding in Consolidation
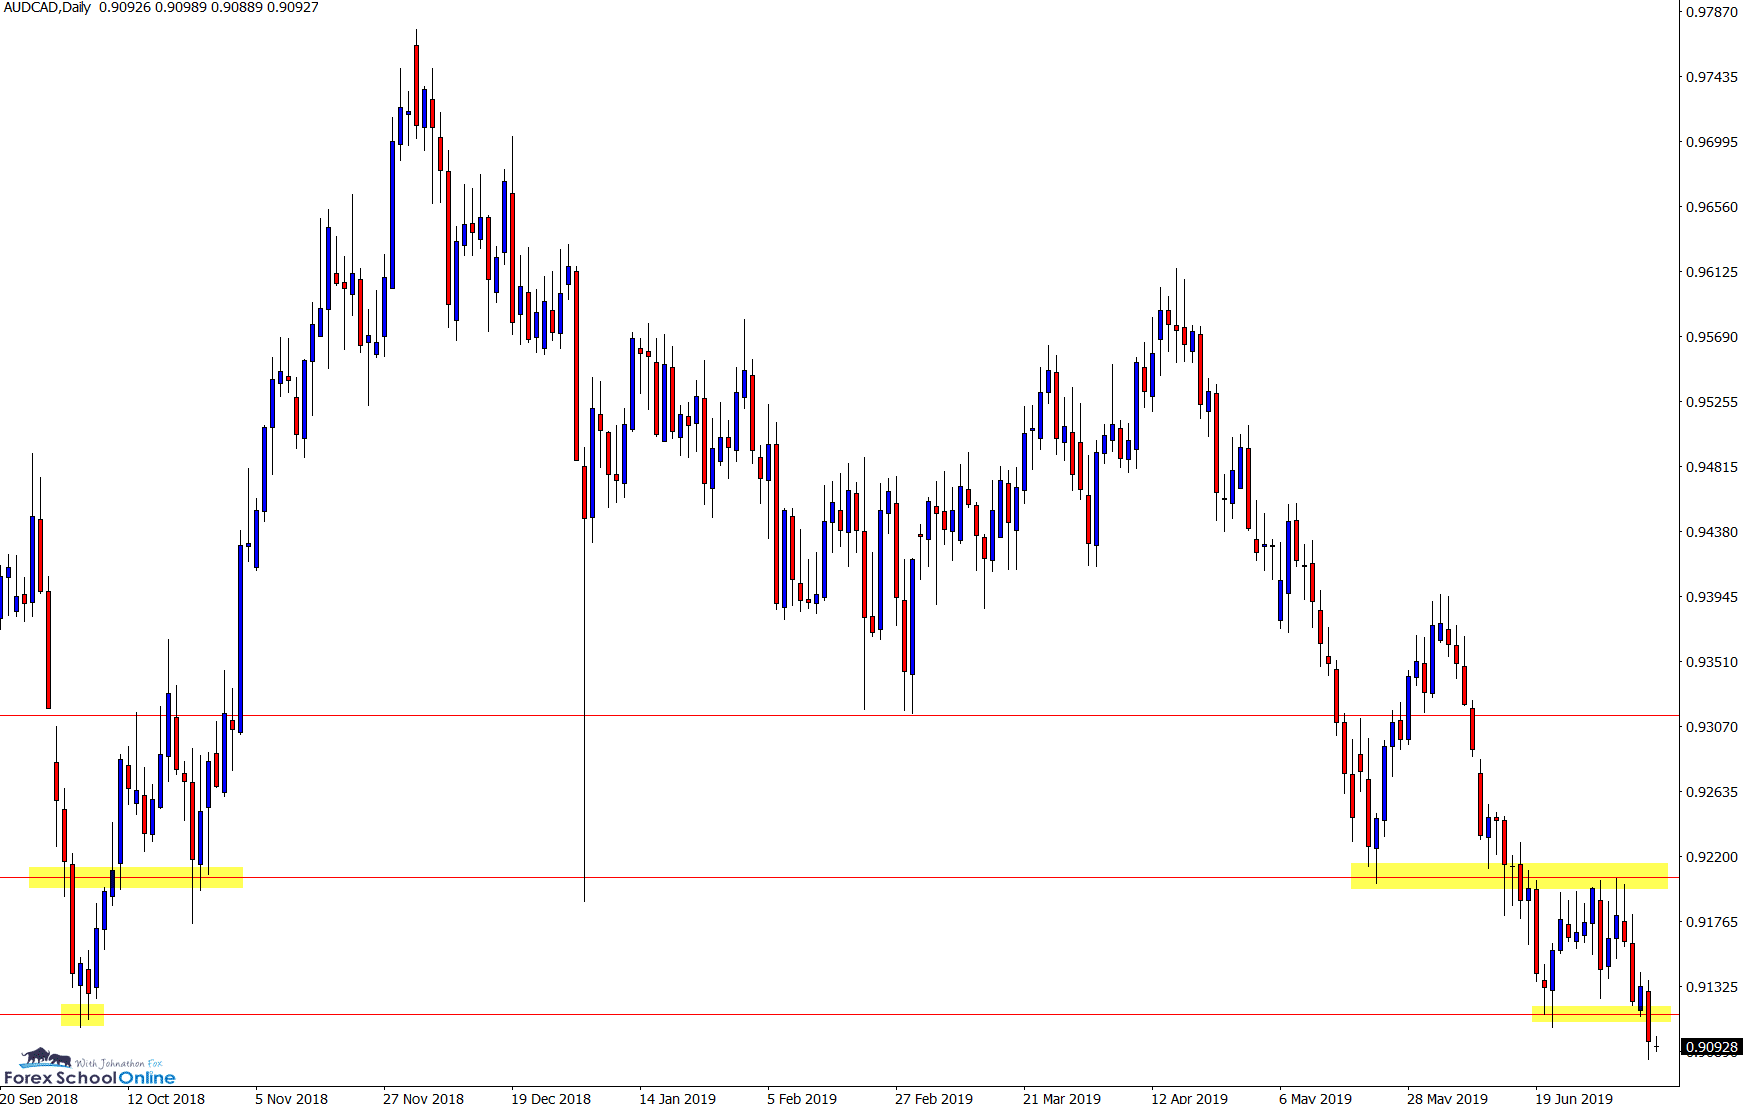
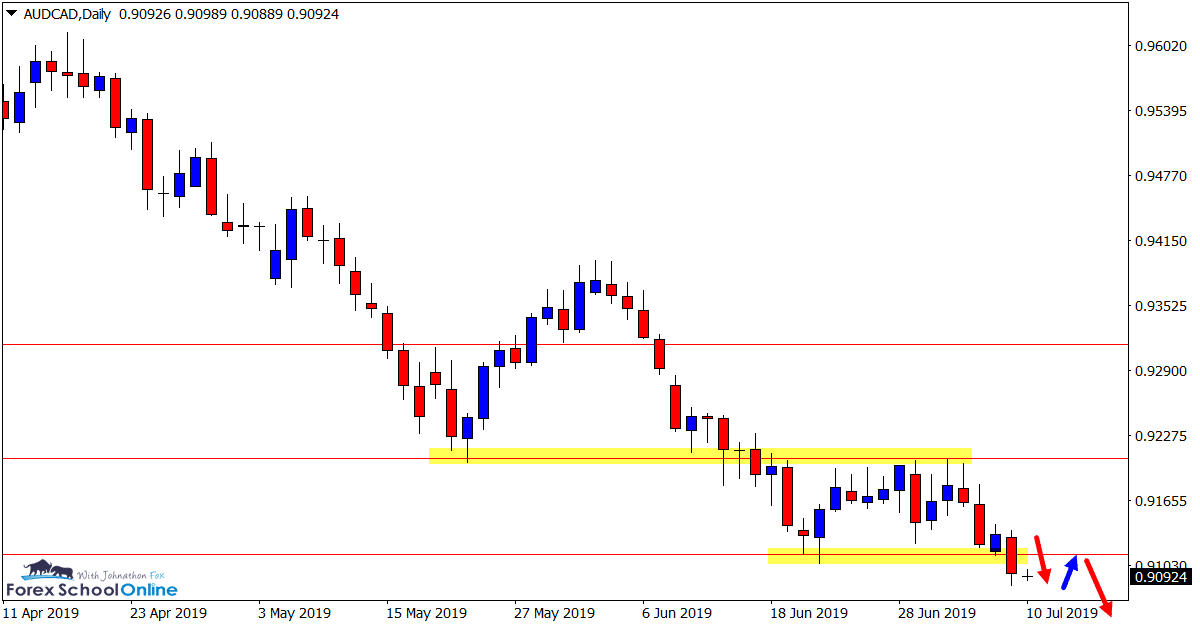
After price broke lower and through the major support around the 0.9200 level, price has consolidated in a sideways box.
Aggressive traders would have been able to look for breakout and retest trades at this level looking for the old support to act as a price flip new resistance.
This pattern could now repeat. If price can break the current daily chart support it is sitting on, potential quick breakout and retest trades could be hunted on the smaller intraday time frames.
Daily Chart
Daily Chart
GBPAUD Daily Chart
Quick Breakout of Major Support
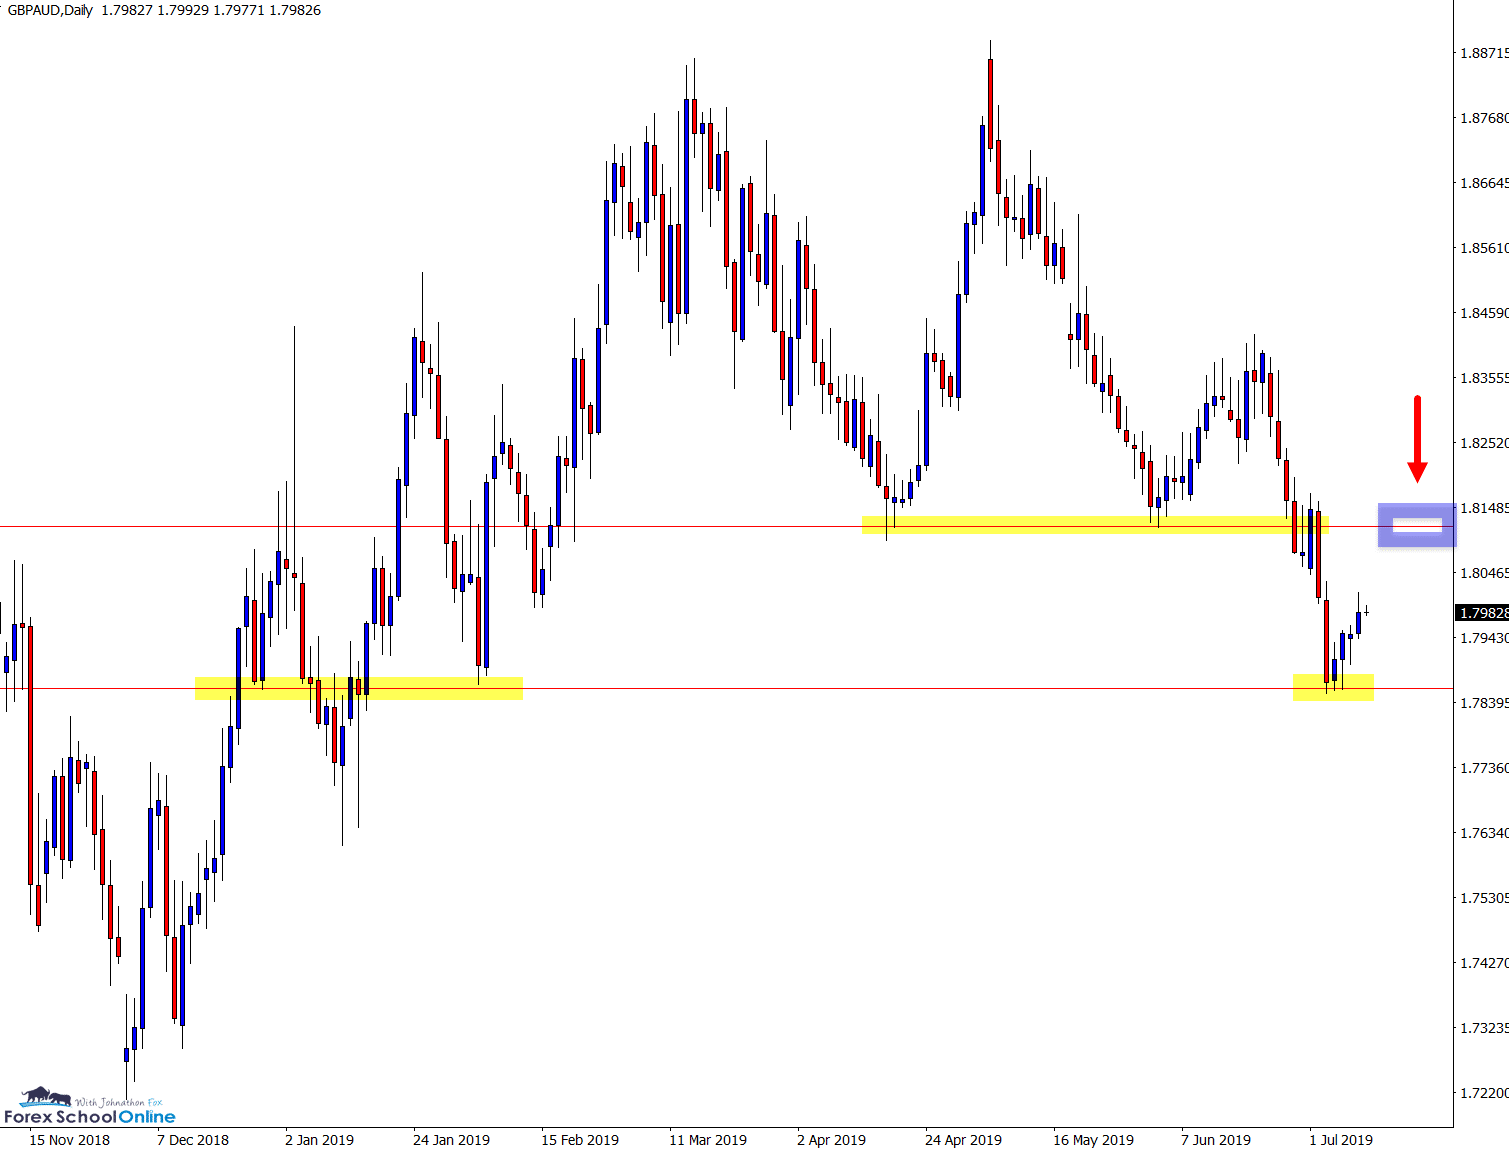
After breaking out lower and through the major support, price quickly raced into the next support level where we are now seeing a bounce higher.
The support that price made the breakout through is a crucial level for this chart and has acted as both support and resistance.
If this latest bounce can push price back higher and into the old support and possible new resistance, potential high probability bearish trigger signals could be hunted on the daily and intraday time frames.
Daily Chart
Note: We Use Correct ‘New York Close 5 Day Charts’ – You can read about why we use these and how to download the correct free charts at Correct Free New York Close Demo Charts
Trade Ideas Note: All views, discussions and posts in the ‘charts in focus’ are the view of Forex School Online and are not recommendations or trading advice. All posts are general in nature and are not advice to buy or sell.
Please leave questions or comments in the comments section below;


for the eurocad would it be better trading the low of the pin bar or the break of the lower low
Hi Jermaine,
when setting entries you have a few options. You can read about how you can use the break here; https://www.forexschoolonline.com//price-action-entry-rules/
Johnathon