The bears may have a temporal control but the overall outlook is bullish.
Both the Medium outlook and the Long-term outlook are in a downward trend
USDJPY Weekly Price Analysis – April 22
If the pressure from the bears increases, price at $108.100 may further drop to $100.
USDJPY Market
Key Levels:
Resistance levels: $110., $112, $114
Support levels: $108, $106, $104
USDJPY Long-term trend: Bearish
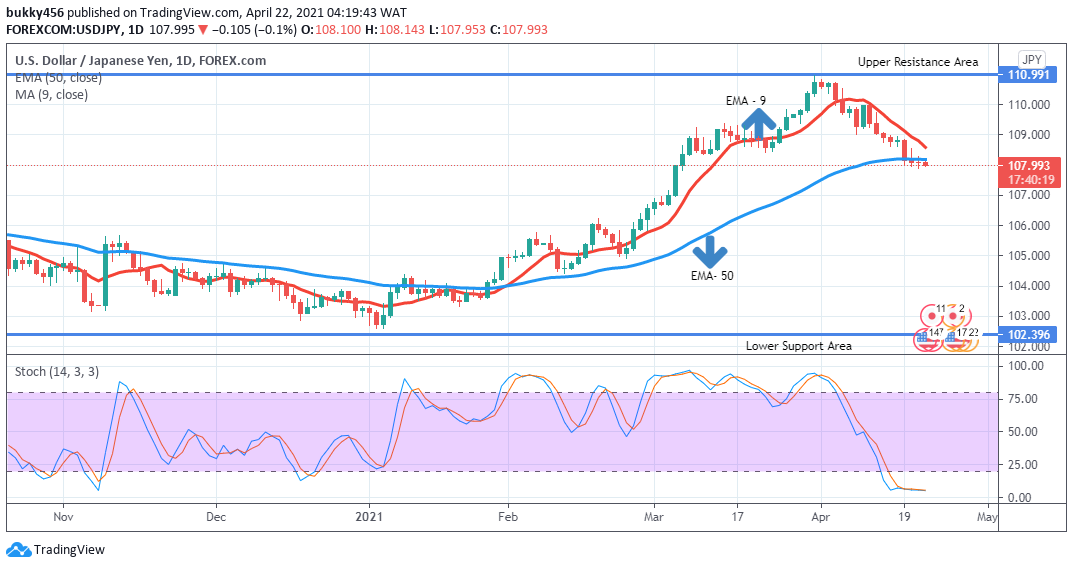
Price of USDJPY is in a downward trend in the long-term perspective. Sellers made a progressive movement to the south with a touch at the 9-EMA. $108 in the support area, as the market opens today.
Today’s daily candle at $108 in the support area is on a bearish note. USDJPY further drops to $107 in the support area below the EMA-9 as the bears took control of the market and the journey down south continues.
Price which is initially down at $107 below the two EMA’s, is an indication of a downward movement in the price of USDJPY.
The stochastic oscillator signal pointing down at around level 5% indicates the momentum in price of USDJPY is in a downward trend and may continue in that trend in the Long-term.
Hence, buyers’ relief.
USDJPY Medium-term Trend: Bearish
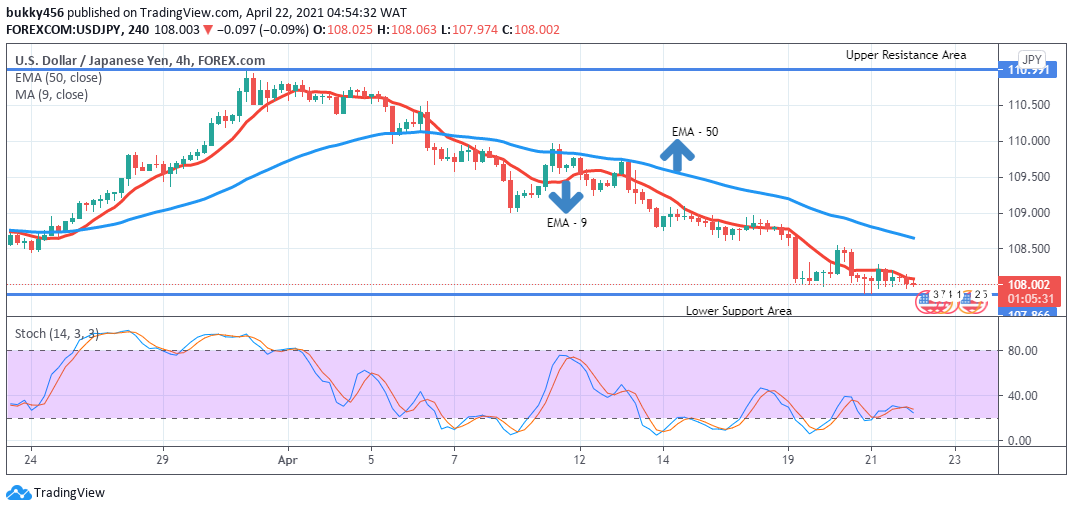
 USDJPY continues in a bearish trend in its medium-term outlook. The sustained bearish pressure pushes the price further down at $107 during yesterday’s session.
Today’s 4-hour chart at $108 in the support area confirms the bears’ dominance in the market.
Price now trades below the two EMAs at $107 down the support area. An indication that sellers are now dictating the market.
The stochastic oscillator signal is pointing up at around level 24% is an indication of a downward momentum in price of USDJPY in the medium-term.
This implies the bears may continue to dictate market direction. Hence, sellers may take a position as desired.
Note: Forexschoolonline.com is not a financial advisor. Do your research before
investing your funds in any financial asset or presented product or event. We
are not responsible for your investing results.


Leave a Reply