• Skip to primary navigation
  • Skip to main content
  • Skip to primary sidebar
  • Skip to footer

ForexSchoolOnline.com

Learn to Trade Forex Online

  • Compare Brokers
    • Broker Type
      • Paypal Brokers
      • Swap-Free Brokers
      • Low Spread Brokers
      • ECN / STP Brokers
      • Market Maker Brokers
      • Non Dealing Desk Brokers
      • Low Minimum Deposit Brokers
    • Country
      • Brokers for Australia
      • Brokers for South Africa
      • Brokers for the UK
      • Brokers for the US
      • Brokers for Nigeria
    • Regulation
      • FCA Regulated Brokers
      • ASIC Regulated Brokers
      • FSCA Regulated Brokers
      • CFTC Regulated Brokers
    • Platform
      • MT4 Brokers
      • MT5 Forex Brokers
    • Strategies
      • Hedging Forex Brokers
      • Scalping Forex Brokers
      • Carry Trade Forex Brokers
      • Brokers for Indicators and EA’s
  • Start Here
    • Start Trading Guide
    • Beginner Trading Lessons
  • Free Forex Course
    • Public Login
    • Register
    • Password recovery
  • Lessons
    • Strategies
    • Videos
    • MT4 Guides
    • Money Management
  • Trade Setups
  • Tools
    • Correct Free Demo Charts
    • Forex Journal Download
    • Position Size Calculator
    • FULL List of Tools
    • Forex Demo Accounts
  • Price Action Guide
  • Free Course

USDJPY: Is Stocked At $124.227 Resistance Level

Johnathon Fox
04/08/2022 | UPDATED ON: 04/08/2022

The currency pair is in an upward momentum both in the long-term outlook and the medium-term outlook.
Overall, the bulls seem to be in control.

USDJPY Weekly Price Analysis – April 8
The breaking up of the $124.552 resistance level by the bulls may increase the price of USDJPY further.

USDJPY Market
Key Levels:

Resistance levels: $123.980, $124.080, $124.180
Support levels:      $121.275, $121.175, $121.075

USDJPY Long-term Trend: Bullish
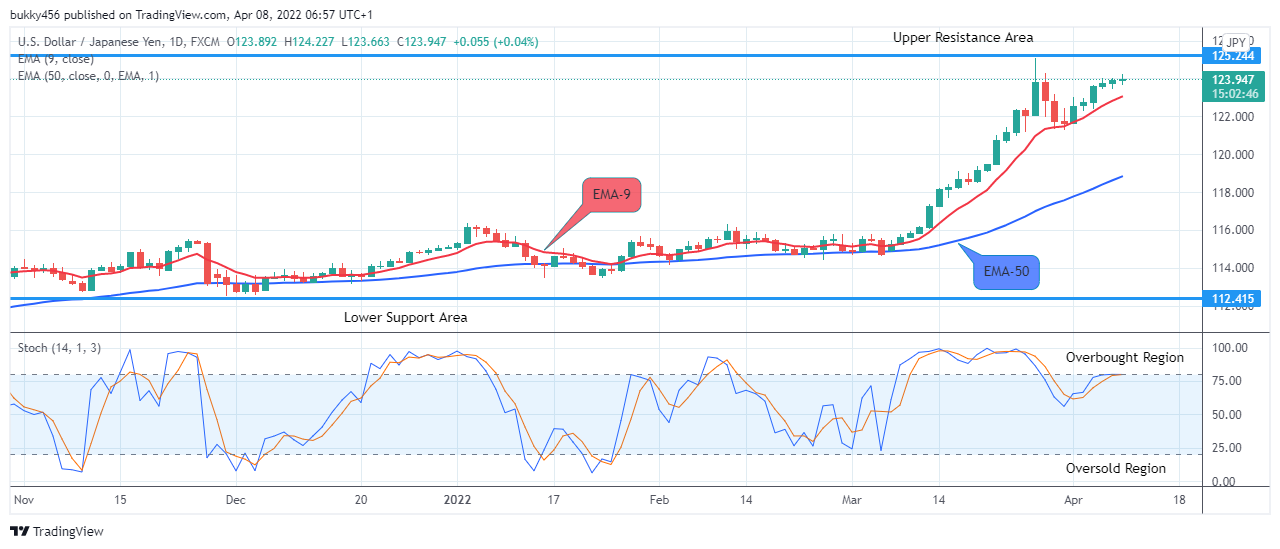
The USDJPY pair still trades in an uptrend in its long-term perspective. The bulls’ pressure on the currency pair at the $123.741 resistance level further led to an increase in the market price of the Yen during yesterday’s session, so best to position ourselves accordingly and see how far this can go.

This, however, gave the buy traders the motive to influence the price tendency. The currency pair’s orientation trades in a general bullish flow. As an outcome of low bearish momentum, the buyers are hindering the market from smashing through the support zones.

Therefore, if the bears increase their tension in the market, the price tendency will drop below the key levels.
The market price continues in an up-north way by the bulls with a doji candle at the $123.892 resistance level as the daily chart opens today. An indication of a trend reversal.

Increase momentum by the bulls moves the market price of the Yen further up to the $123.977 resistance level as it journeys up north.

The market value of USDJPY is initially up at the $124.227 resistance level above the two EMAs, an indication of an upward trend in the context of the strength of the market.

USDJPY is around level 80% range of the daily stochastic which is pointing sideways in the overbought region, this implies that the buying pressure might likely experience a change in trend in its long-term perspective, and in this case, its undecided trend as the indicator is pointing sideways.

Traders should exercise patience and see the direction of the market either bullish or bearish before placing an order at the moment in the long-term outlook.

USDJPY Medium-term Trend: Bullish
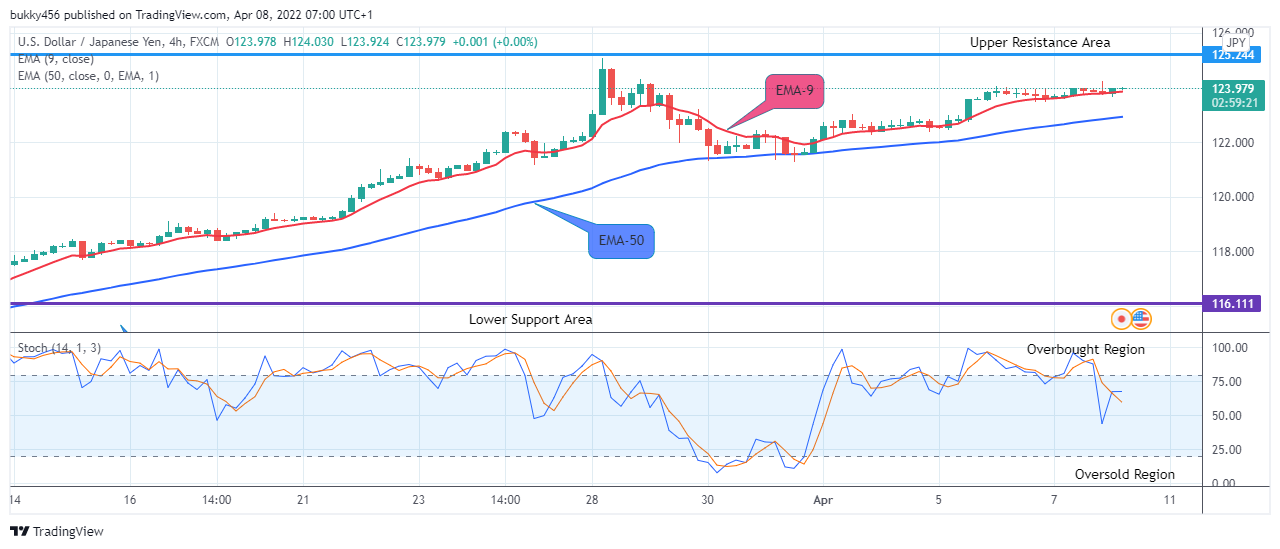
The price movement of USDJPY is currently seen to be in the bull’s direction in the medium-term outlook. The sustained bullish pressure pushed the pair up to the $123.998 resistance level during yesterday’s session and sustained it.

Today’s 4-hourly opening chart opens with a doji candle at a $123.978 resistance level as the bulls remain dominant in the market.

The price action rises significantly to the $124.027 resistance level as the journey to the north continues.

The market value of the pair is up at a $124.046 resistance value above the two EMAs which are fanned apart, this implies that the bulls are in control of the market at the present.

The pair which is pointing up around 70% of the daily stochastic in the overbought region also indicates that the price of USDJPY is in an uptrend, more so sellers are expected to emerge to drop the price of the Yen in the nearby days in the medium-term.

Therefore, sellers may wait for this action to occur before taking their position as desired.

Note: Forexschoolonline.com is not a financial advisor. Do your research before investing your funds in any financial asset or presented product or event. We are not responsible for your investing results.


Recommended Broker

  • Broker
  • Min Deposit
  • Benefits
  • Score
  • Visit Broker

$200

T&Cs Apply
  • The Lowest Trading Costs
  • 50% Welcome Bonus
  • Award-winning 24 Hour Support
5
Trade Now FreeBets Reviews
Reviews

About Johnathon Fox

Johnathon is a Forex and Futures trader with over ten years trading experience who also acts as a mentor and coach to thousands and has written for some of the biggest finance and trading sites in the world.

View all posts by Johnathon Fox →
Previous Post: « USDCHF Is Disposed to Break the Upside of Its Symmetric Triangle
Next Post: EURCHF Moves in Favour of the Market Sellers »

Reader Interactions

Leave a Reply Cancel reply

Your email address will not be published. Required fields are marked *

Primary Sidebar

Forex School Online

High Probability Price Action Trading

How to make, manage and take profit from trades in the markets

Start Learning (It's Free!)

Turn Your Trades into Winners!

The Price action course is the in-depth advanced training on assessing, making and managing high probability price action trades.

Sign up for Free!

Recommended Broker

  • Broker
  • Min Deposit
  • Benefits
  • Score
  • Visit Broker

$200

T&Cs Apply
  • The Lowest Trading Costs
  • 50% Welcome Bonus
  • Award-winning 24 Hour Support
5
Trade Now FreeBets Reviews
Reviews

Footer

Get Our FREE Course, Bonus Strategies & Indicators!
X
Join Us Now!

Your capital is at risk.

X

CORNERSTONE LESSONS

Forex Trading for Beginners

Price Action Trading

How to Trade Forex

Technical Analysis

Forex Charts

Forex Trading Strategies

Money Management 

Compare Brokers

Best Forex Brokers

Forex Demo Accounts

Best Forex Trading Platforms

Forex Apps

Swap Fee Accounts

MT4 Brokers

CATEGORIES

Forex Videos

Trading Lessons

Weekly Trade Ideas

Start Here Guide

ForexSchoolOnline.com helps individual traders learn how to trade the Forex market

WARNING: The content on this site should not be considered investment advice and we are not authorised to provide investment advice. Nothing on this website is an endorsement or recommendation of a particular trading strategy or investment decision. The information on this website is general in nature so you must consider the information in light of your objectives, financial situation and needs.

Investing is speculative. When investing your capital is at risk. This site is not intended for use in jurisdictions in which the trading or investments described are prohibited and should only be used by such persons and in such ways as are legally permitted. Your investment may not qualify for investor protection in your country or state of residence, so please conduct your own due diligence or obtain advice where necessary. This website is free for you to use but we may receive a commission from the companies we feature on this site.

We Introduce people to the world of currency trading. and provide educational content to help them learn how to become profitable traders. we're also a community of traders that support each other on our daily trading journey

Forexschoolonline.com is not a financial advisor. Do your research before investing your funds in any financial asset or presented product or event. We are not responsible for your investing results.

Copyright © Forex School Online Sitemap  - Privacy Policy - Disclaimers & Terms of Use - CONTACT US