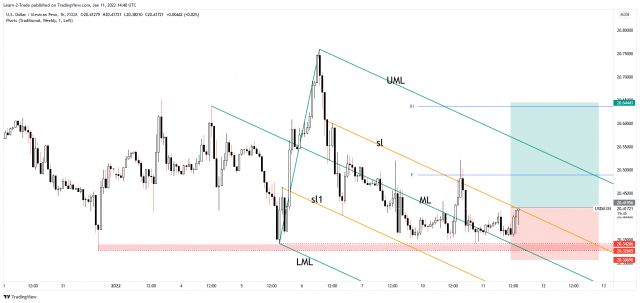
The USD/MXN pair moved sideways in the short term right above the 20.342 – 20.326 support zone. Being near a demand zone, personally, I was looking for long opportunities. In the short term, the pair attracted more bullish energy before trying to develop a new leg higher.
Fundamentally, the currency pair dropped a little in yesterday’s trading session as the US Final Wholesale Inventories registered a 1.4% growth versus 1.2% expected, which was bad for the USD. At the time of writing, the Fed Chair Powell Testifies brought high volatility, that’s why the pair registered sharp movements. Tomorrow, the US CPI and the Core CPI could really shake the markets.
USD/MXN Technical Analysis!

USD/MXN moved sideways signaling that the sellers are exhausted. Now, it challenges the inside sliding line (sl) which represents a strong dynamic resistance. A valid breakout above it may confirm an upside continuation.
As you can see on the H4 chart, the pair failed to stay under the median line (ML) signaling that the downwards movement ended. In the short term, a new false breakout above the immediate dynamic resistance could signal a new potential drop towards the major support zone, down to the previous lows.
Note: ForexSchoolOnline is not a financial advisor. Do your research before investing your funds in any financial asset or presented product or event. We are not responsible for your investing results.


Leave a Reply