• Skip to primary navigation
  • Skip to main content
  • Skip to primary sidebar
  • Skip to footer

ForexSchoolOnline.com

Learn to Trade Forex Online

  • Compare Brokers
    • Broker Type
      • Paypal Brokers
      • Swap-Free Brokers
      • Low Spread Brokers
      • ECN / STP Brokers
      • Market Maker Brokers
      • Non Dealing Desk Brokers
      • Low Minimum Deposit Brokers
    • Country
      • Brokers for Australia
      • Brokers for South Africa
      • Brokers for the UK
      • Brokers for the US
      • Brokers for Nigeria
    • Regulation
      • FCA Regulated Brokers
      • ASIC Regulated Brokers
      • FSCA Regulated Brokers
      • CFTC Regulated Brokers
    • Platform
      • MT4 Brokers
      • MT5 Forex Brokers
    • Strategies
      • Hedging Forex Brokers
      • Scalping Forex Brokers
      • Carry Trade Forex Brokers
      • Brokers for Indicators and EA’s
  • Start Here
    • Start Trading Guide
    • Beginner Trading Lessons
  • Free Forex Course
    • Public Login
    • Register
    • Password recovery
  • Lessons
    • Strategies
    • Videos
    • MT4 Guides
    • Money Management
  • Trade Setups
  • Tools
    • Correct Free Demo Charts
    • Forex Journal Download
    • Position Size Calculator
    • FULL List of Tools
    • Forex Demo Accounts
  • Price Action Guide
  • Free Course

GBP/USD Market Extends Profits in Bullish Recovery Channels

Johnathon Fox
01/12/2022 | UPDATED ON: 01/12/2022

British Pound Price Prediction – January 11
It is now apparent that the GBP/USD price experiences northward motion as the currency pair market extends profits in bullish recovery channels. The market opens today’s operation at around 1.3575 to witness a higher trading line of about 1.3619 and a; lower point of about 1.3561. The market percentage rate is 0.17, as of writing.

GBP/USD Market
Key Levels:
Resistance levels: 1.3700, 1.3800, 1.3900
Support levels: 1.3500, 1.3400, 1.3300

GBP/USD – Daily Chart
Today’s GB P/USD daily chart showcases that the currency pair market extends profits in bullish recovery channels. In a bid to continue to the north side, variant smaller bullish candlesticks are being occurred briefly above the trend line of the bigger SMA. The 14-day SMA indicator is beneath the 50-day SMA indicator, pointing toward the north side to indicate that some momentums are still gathering to the upside. The Stochastic Oscillators are in the overbought region, moving in a firm consolidation manner to establish that the base trading instrument is still in the control of the market.
Should long-position takers of the GBP/USD trade hold on to their positions as the currency pair market extends profits in bullish recovery?
Technically, the GBP/USD trade long-position takers to stay alert to know when there will be an emergence of a bearish candlestick engulfing some of the penultimate bullish candlesticks to suspend holding the long positions opened. If that assumption play plays out, the market may get a convergence-setting pattern, denoting against getting more ups. If that presumption doesn’t materialize, the price may somewhat systemically extend more beyond the resistance at 1.3700 afterward.

On the downside of the technical analysis, the GBP/USD market short-position takers needed to exercise some degrees of patience not to hurry to start launching sell orders as there has been no significant sell signal warranting that as of the moment. However, the price may soon encounter resistance around 1.3700 that can, in the long run, give room to the creation of an ideal formation to suggest a closure completion of the current upward trend.

In summary, as the GBP/USD market has reached an overbought state, traders needed to stay off for a while and be alert as to when there will be an emergence of a bearish candlestick to engulf some of the immediate past bullish candlesticks before considering a sell order position at a higher trading zone.
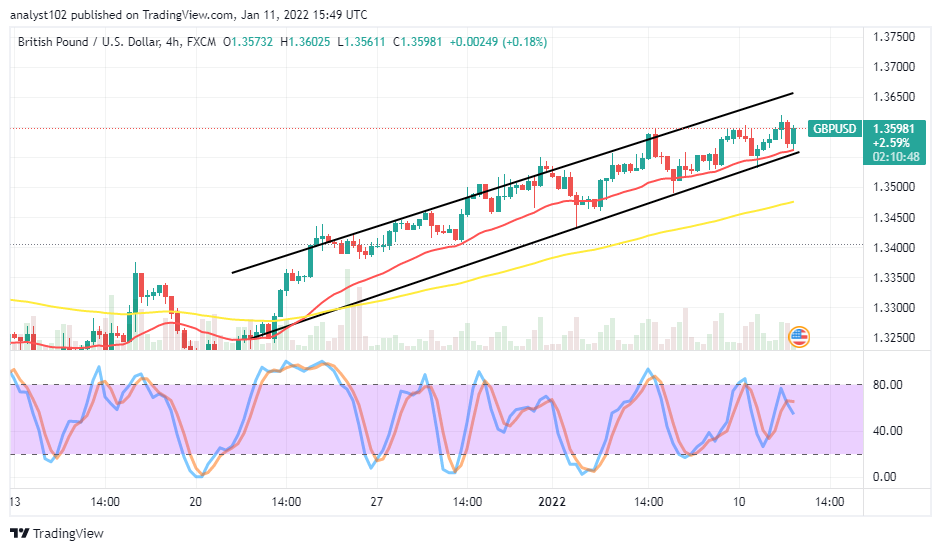
GBP/USD 4-hour Chart
The GBP/USD medium-term chart reveals that the currency pair market extends profits in bullish channel trend lines. The bullish channels portend an extreme posture toward the north direction. The 14-day SMA is above the 50-day SMA The Stochastic Oscillators have crossed their lines southbound underneath the range of 80. A bullish candlestick is currently emerging to possibly lead the market up to eventfully encounter resistance around 1.3650 before succumbing to decent depressions once again.


Note:Forexschoolonline.com is not a financial advisor. Do your research before investing your funds in any financial asset or presented product or event. We are not responsible for your investing results.

Recommended Broker

  • Broker
  • Min Deposit
  • Benefits
  • Score
  • Visit Broker

$200

T&Cs Apply
  • The Lowest Trading Costs
  • 50% Welcome Bonus
  • Award-winning 24 Hour Support
5
Trade Now FreeBets Reviews
Reviews

About Johnathon Fox

Johnathon is a Forex and Futures trader with over ten years trading experience who also acts as a mentor and coach to thousands and has written for some of the biggest finance and trading sites in the world.

View all posts by Johnathon Fox →
Previous Post: « USD/MXN New Leg Higher!
Next Post: Annual Forecast for GBPJPY (2022) »

Reader Interactions

Leave a Reply Cancel reply

Your email address will not be published. Required fields are marked *

Primary Sidebar

Forex School Online

High Probability Price Action Trading

How to make, manage and take profit from trades in the markets

Start Learning (It's Free!)

Turn Your Trades into Winners!

The Price action course is the in-depth advanced training on assessing, making and managing high probability price action trades.

Sign up for Free!

Recommended Broker

  • Broker
  • Min Deposit
  • Benefits
  • Score
  • Visit Broker

$200

T&Cs Apply
  • The Lowest Trading Costs
  • 50% Welcome Bonus
  • Award-winning 24 Hour Support
5
Trade Now FreeBets Reviews
Reviews

Footer

Get Our FREE Course, Bonus Strategies & Indicators!
X
Join Us Now!

Your capital is at risk.

X

CORNERSTONE LESSONS

Forex Trading for Beginners

Price Action Trading

How to Trade Forex

Technical Analysis

Forex Charts

Forex Trading Strategies

Money Management 

Compare Brokers

Best Forex Brokers

Forex Demo Accounts

Best Forex Trading Platforms

Forex Apps

Swap Fee Accounts

MT4 Brokers

CATEGORIES

Forex Videos

Trading Lessons

Weekly Trade Ideas

Start Here Guide

ForexSchoolOnline.com helps individual traders learn how to trade the Forex market

WARNING: The content on this site should not be considered investment advice and we are not authorised to provide investment advice. Nothing on this website is an endorsement or recommendation of a particular trading strategy or investment decision. The information on this website is general in nature so you must consider the information in light of your objectives, financial situation and needs.

Investing is speculative. When investing your capital is at risk. This site is not intended for use in jurisdictions in which the trading or investments described are prohibited and should only be used by such persons and in such ways as are legally permitted. Your investment may not qualify for investor protection in your country or state of residence, so please conduct your own due diligence or obtain advice where necessary. This website is free for you to use but we may receive a commission from the companies we feature on this site.

We Introduce people to the world of currency trading. and provide educational content to help them learn how to become profitable traders. we're also a community of traders that support each other on our daily trading journey

Forexschoolonline.com is not a financial advisor. Do your research before investing your funds in any financial asset or presented product or event. We are not responsible for your investing results.

Copyright © Forex School Online Sitemap  - Privacy Policy - Disclaimers & Terms of Use - CONTACT US