USD/CAD Long-Term Analysis: Bearish
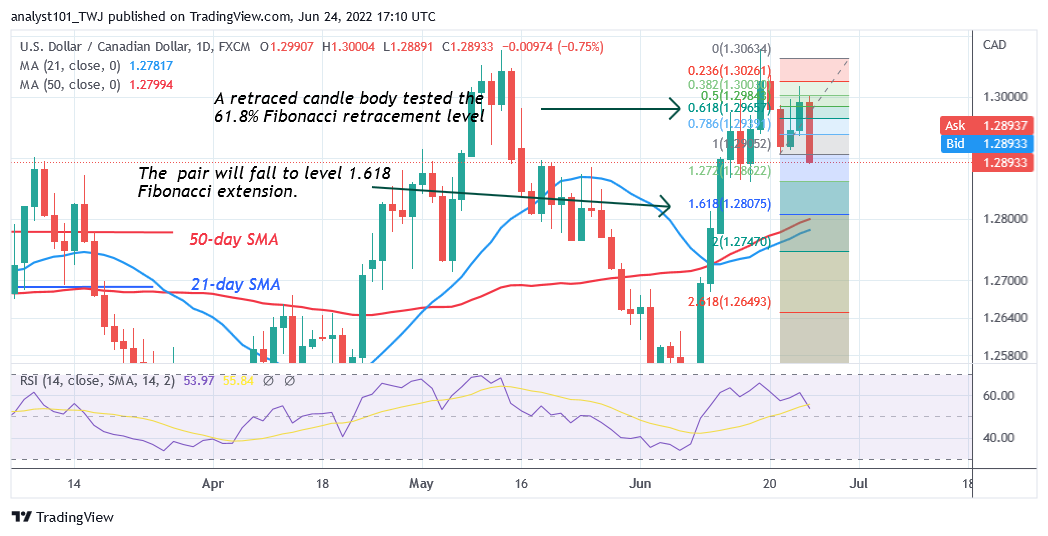
USD/CAD is in an uptrend but the pair is declining as it may find support above 1.2800. The currency pair is likely to retrace briefly before resuming the uptrend. On the downside, if the pair falls and breaks below the moving averages, the market will decline to the previous low at level 1.2520. Meanwhile, on June 21 downtrend; a retraced candle body tested the 61.8% Fibonacci retracement. The retracement suggests that the pair will fall to level 1.618 Fibonacci extension or level 1.28075.
USD/CAD Indicator Analysis
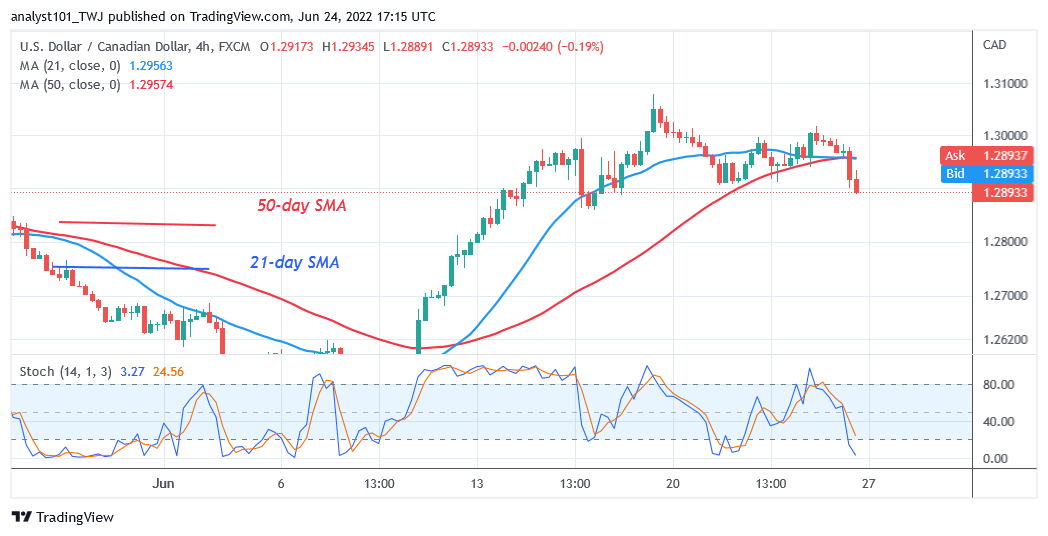
USD/CAD has risen to level 53 of the Relative Strength Index for period 14. The currency pair is trading in the bullish trend zone but it is retracing after a rejection. The price bars are above the 50-day line SMA and the 21-day line SMA indicating a further upward movement of the pair.USD/CAD is below the 40% range of the daily stochastic. The market is a bearish momentum.

Technical indicators:
Major Resistance Levels – 1.3300, 1.3400, 1.3500
Major Support Levels – 1.2300, 1.2200, 1.2100
What Is the Next Direction for USD/CAD?
USD/CAD is in a downward move as it may find support above 1.2800. The implication is that selling pressure will continue to the downside. In the previous price action, the currency pair dropped to the low of level 1.2520 price levels. In the meantime, the market has fallen to the low of 1.2893 price level.

Note: Forexschoolonline.com is not a financial advisor. Do your research before investing your funds in any financial asset or presented product or event. We are not responsible for your investing results


Leave a Reply