USD/CAD Long-Term Analysis: Ranging
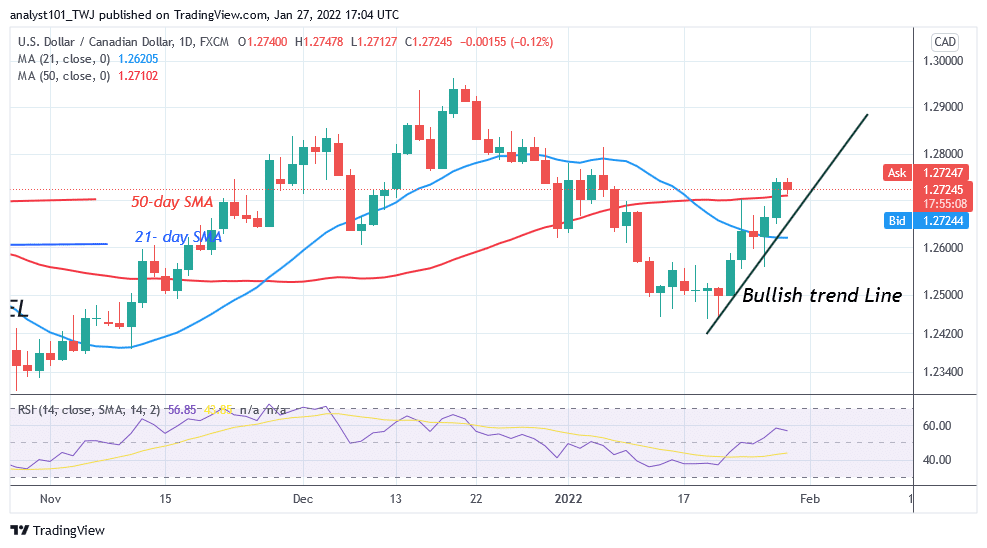
USD/CAD is in an uptrend as it poises to revisit level 1.2900 high. The currency pair has broken above the moving averages. USD/CAD will continue to rise if the bullish momentum is sustained above the moving averages. The currency price is making a series of higher highs and higher lows. On December 20 uptrend, buyers failed to keep the price above level 1.2900. Consequently, the currency pair dropped to level 1.2500 and resumed a fresh uptrend. The current uptrend is ongoing as it breaks above the moving averages.
USD/CAD Indicator Analysis
The currency pair is in an upward move as the index reaches level 56 of the Relative Strength Index period 14. The market is likely to rise as the pair trades in the bullish trend zone. The pair is above the 80% range of the daily stochastic. This implies that the current uptrend is likely to face resistance as the market reaches an overbought region of the market. The 21-day SMA and the 50-day SMA are sloping upward indicating an uptrend.

Technical indicators:
Major Resistance Levels – 1.3300, 1.3400, 1.3500
Major Support Levels – 1.2300, 1.2200, 1.2100
What Is the Next Direction for USD/CAD?
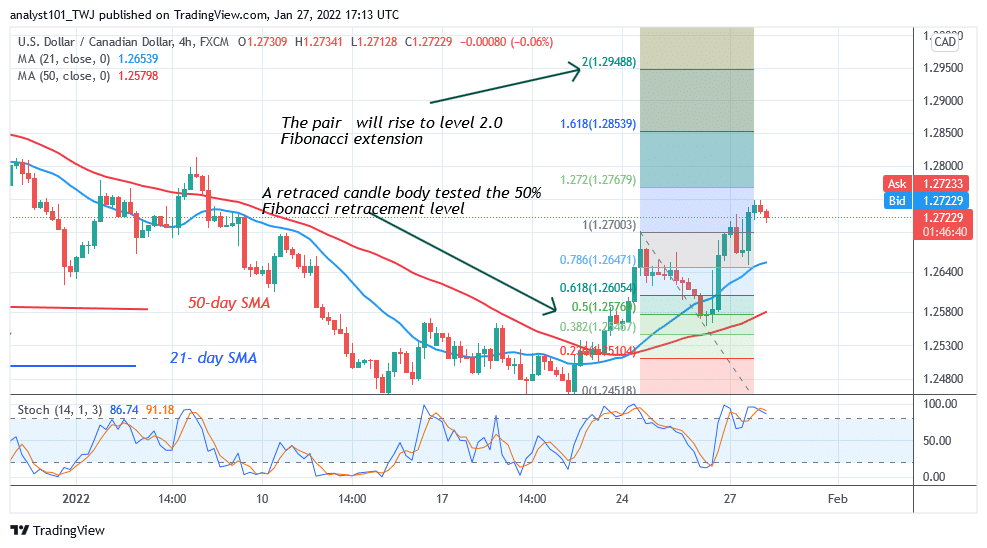
USD/CAD is making an upward move but poises to revisit level 1.2900 high. The pair is likely to retrace to the downside. On the 4-hour chart, the currency price has broken above the moving averages as the market reached the high of 1.2723. Meanwhile, on January 24 uptrend; a retraced candle body tested the 50% Fibonacci retracement level. The retracement suggests that the pair will rise to level 2.0 Fibonacci extension or 1.2948. From the price action, the pair have only reached level 1.2747 which is an overbought region of the market.

Note: Forexschoolonline.com is not a financial advisor. Do your research before investing your funds in any financial asset or presented product or event. We are not responsible for your investing results


Leave a Reply