USD/CAD Long-Term Analysis: Bullish
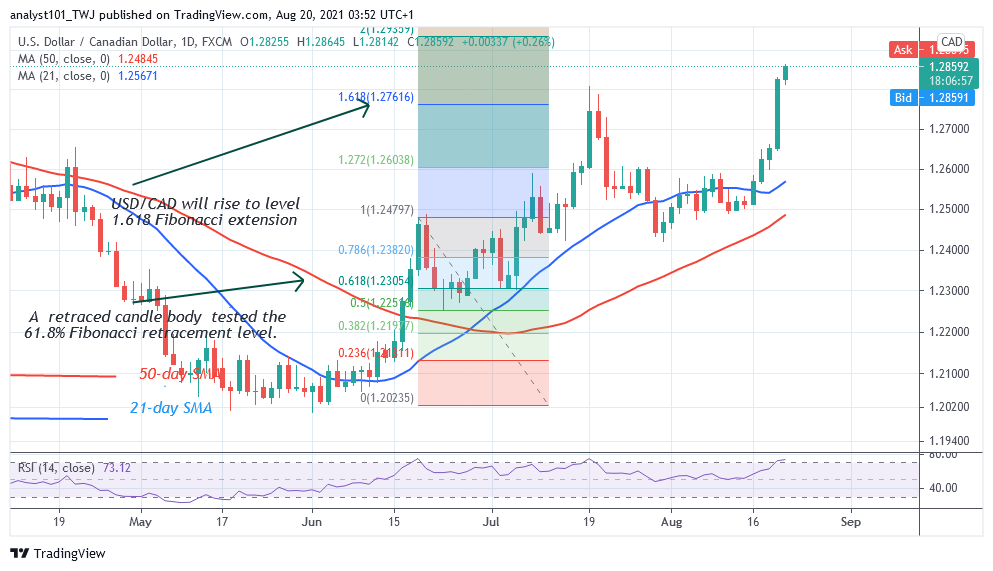
USD/CAD is in an upward move after the previous rejection. On August 19, the bulls broke the previous resistance at level 1.2800. Today, the pair is approaching the high of level 1.2859. On July 19, the pair tested the high of 1.2800 and was repelled. The currency pair reached the low of 1.2400 and resumed a fresh uptrend. Presently, the Relative Strength Index period 14 has indicated an overbought condition of the currency pair. USD/CAD is unlikely to rally on the upside. In the previous price action, the Fibonacci tool indicated that the pair will reach a high of 1.2800. The market reached the price level and reversed.
USD/CAD Indicator Analysis
USD/CAD has risen to level 73 of the Relative Strength Index period 14. It indicates that the pair is now in the overbought region. Sellers will emerge to push prices down. The 21-day and 50-day SMAs are sloping upward indicating the uptrend. The pair is also above the 80% range of the daily stochastic. The market is also said to be in the overbought region. The pair is likely to fall.
Technical indicators:
Major Resistance Levels – 1.3300, 1.3400, 1.3500
Major Support Levels – 1.2300, 1.2200, 1.2100
What Is the Next Direction for USD/CAD?
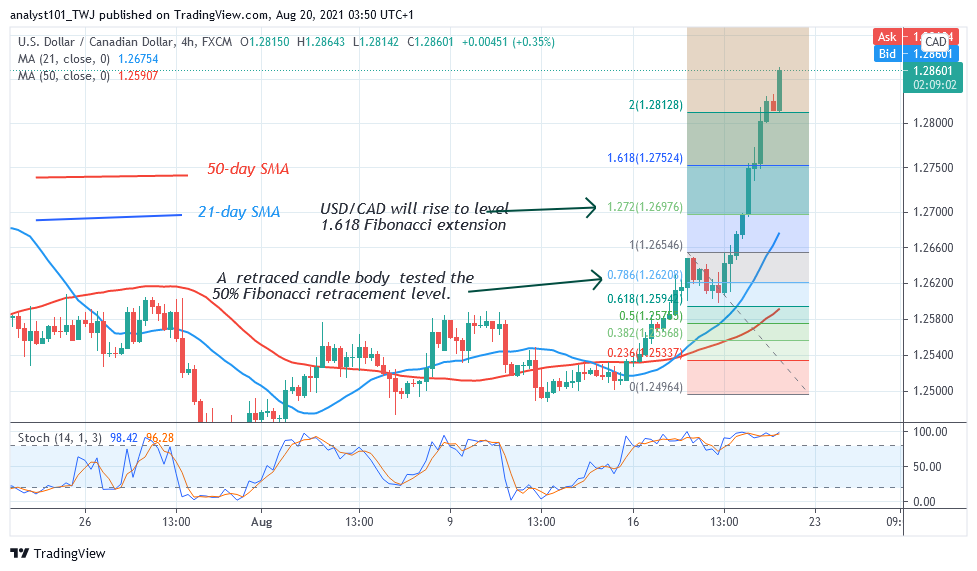
USD/CAD has risen to level 1.2859 which is above the previous resistance of 1.2800. The pair is trading in the overbought region of the market. A further upper move is unlikely. On the 4 –hour chart, USD/CAD breaks above level 1.272 Fibonacci extension and continues to the high of 1.2859. The overbought condition is yet to hold.
Note: Forexschoolonline.com is not a financial advisor. Do your research before investing your funds in any financial asset or presented product or event. We are not responsible for your investing results

Leave a Reply