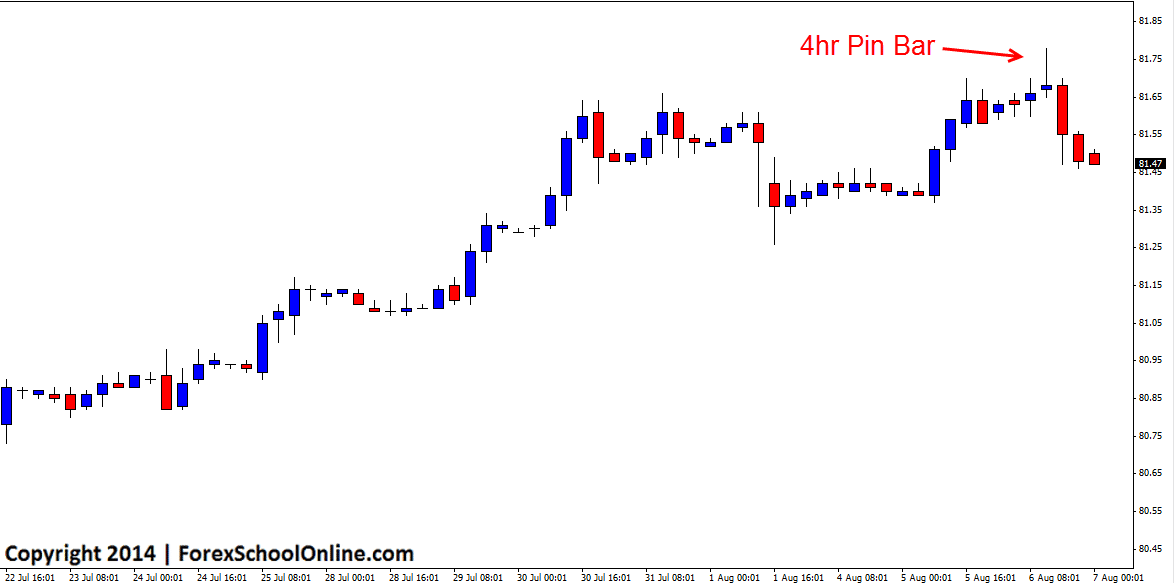
The US Dollar index (a measure of the value of the United States dollar relative to a basket of foreign currencies) has during the previous session roared higher to reach a new high for the year, before then producing a 4hr pin bar. This pin bar on the 4hr chart was clearly rejecting higher prices as price had just recently stalled at this same area and was starting to form a top.
After breaking the low of the pin bar and confirming the setup, price has now sold off and made a move lower into the near term support around the 81.45 area. Price has been in a very strong up-trend in this market of late on both the daily and 4hr charts with the 4hr chart showing quite clearly how strong this trend has been with very obvious higher highs and higher lows in place.
With this new high for the year now being rejected, price may at this stage just be taking a breather and making a rotation back into a value area before once again having another crack at moving higher and back into fresh highs. As has been discussed regularly in this blog this year, a lot of the major index’s have been in super strong up-trends and the best way to play these this year especially, has been to wait for pull-backs or rotations back into value areas and then look for long trade opportunities with the obvious trend. A really good example of this has been on the Dow Jones that has broken higher to make 15 new all time highs this year alone and in between has been making some solid rotations back lower to give traders a solid chance to look for long trades to join the up-trend.
USD Dollar Index 4hr Chart


Leave a Reply