Tamadoge Price Prediction – July 12
A particular mode of transactions has been predominantly enforced in the Tamadoge market operations against the US dollar as the crypto-economic trade hovers in decline, preparing for a hike in the womb of time.
The composure of gravitational pressure in the market has been closely observed to be gathering again in the phase of Oscillators’ potency index, suggesting that a line of downs might soon set in toward allowing buyers to reposition for long orders at a more possible lower-trading point between $0.01200 and $0.01000 in the near future.
TAMA/USD Market
Key Levels
Resistance levels: $0.01300, $0.01400, $0.01500
Support levels: $0.01000, $0.00900, $0.00800
TAMA/USD – 4-hour Chart
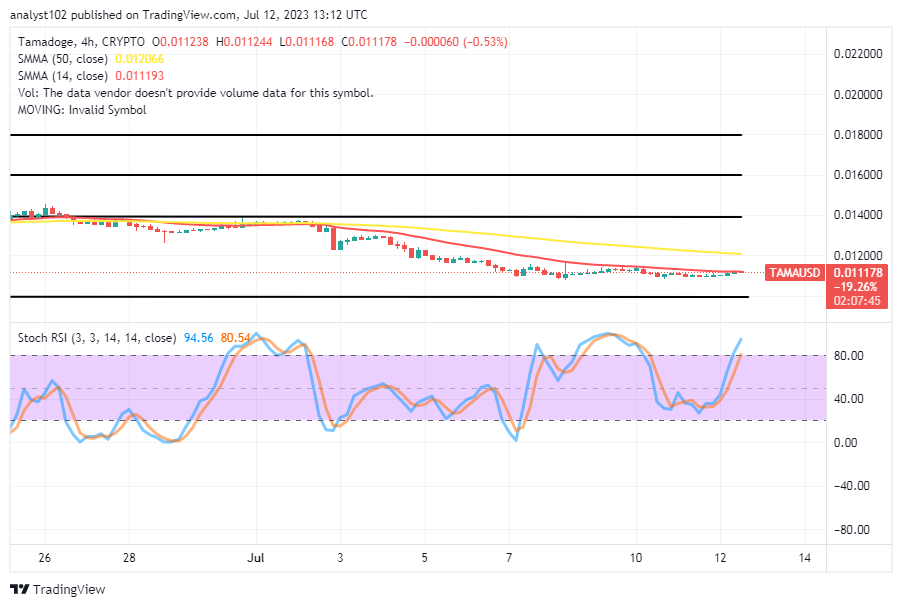
The TAMA/USD 4-hour chart reveals that the crypto-economic trade hovers in a decline of poor moves, preparing for a possible hike in the near session around the trend line of a smaller trading indicator.
The reaction of the market pressures has been illustrated by the positioning of the 14-day SMA trend line to be around $0.011193 underneath the value line of the 50-day SMA trend line, which is around $0.012066. The Stochastic Oscillators have penetrated the overbought region to maintain the points of 80.54 to 94.56. In the meantime, a production of a smaller 4-jour candlestick has surfaced around the psychological trade spot of the smaller Moving Average.
What does the formation of the present candlestick suggest around the 14-day SMA in the TAMA/USD trade?
As it has been showcased by the physical technical reading outlook of the present situation in the TAMA/USD market operations, price is likely to remain under a setting myth to breathe before bouncing up for profits, noticeably that the crypto-economic trade is hovering in a decline, preparing for hiking probably soon.
Systemically, the pressures to the downside have kept on a feeble losing mood to give room to a procedure that would allow buyers to garner catalysts in a holding form ahead of presumably rebounds in no time. The train of the trade has only been pinned down for more investing moments to come in. Therefore, sellers shouldn’t allow themselves to be deceived.
TAMA/USD 1-hour chart
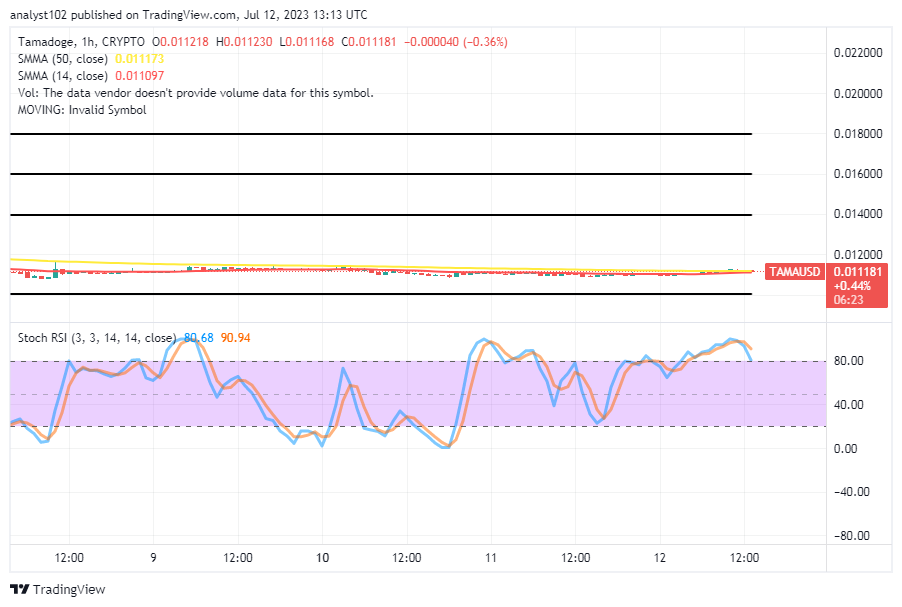
The TAMA/USD 1-hour chart showcases the crypto-economic trade hovering in a decline, preparing for a hike.
Based on the formation style of the trading indicators, both the 14-day SMA and 50-day SMA trend lines have remained positioned eastward around the values of $0.011173 and $0.011097. The Stochastic Oscillators positioned southbound in the overbought region by placing from 90.94 to 80.68. It means that in the absence of bulls pulling up muscles abruptly at any time, some lows are liable to play out.
It’s time to satisfy your lunchtime cravings. If you don’t yet have the app, Why do you still have this tweet open?
It’s time to get your lunchtime fix 😉
— TAMADOGE (@Tamadogecoin) July 11, 2023
If you haven’t got the app yet… Why are you still reading this tweet?
📲
🍏: https://t.co/k3NV8IkQnf
🤖: https://t.co/KjO2dW3Jwf pic.twitter.com/s3UTbI2rTy
Do you want a coin that would 100X in the next few months? That is Tamadoge. Buy TAMA today
Note: Forexschoolonline.com is not a financial advisor. Do your research before investing your funds in any financial asset or presented product or event. We are not responsible for your investing results.


Leave a Reply