Tamadoge Price Prediction – October 8
A chain of price actions has surfaced in the market activities between Tamadoge and the US Dollar, showcasing that the crypto-economic trade finds support around $0.008500, moving northward through the overhead resistances.
Below the resistance level of $0.01000, a methodical system of trade reversal has flourished, allowing long-position pushers to reset for buying options at the majority of repeatedly decreasing rates. The circumstances have also made it possible for new investors to enter the developing crypto economy before its erratic rising cycles. Sellers should maintain positions carefully as a result of that prognosis, especially below the point mentioned initially.
TAMA/USD Market
Key Levels
Resistance levels: $0.009500, $0.01000, $0.01050
Support levels: $0.008000, $0.007500, $0.007000
TAMA/USD Medium-term Chart
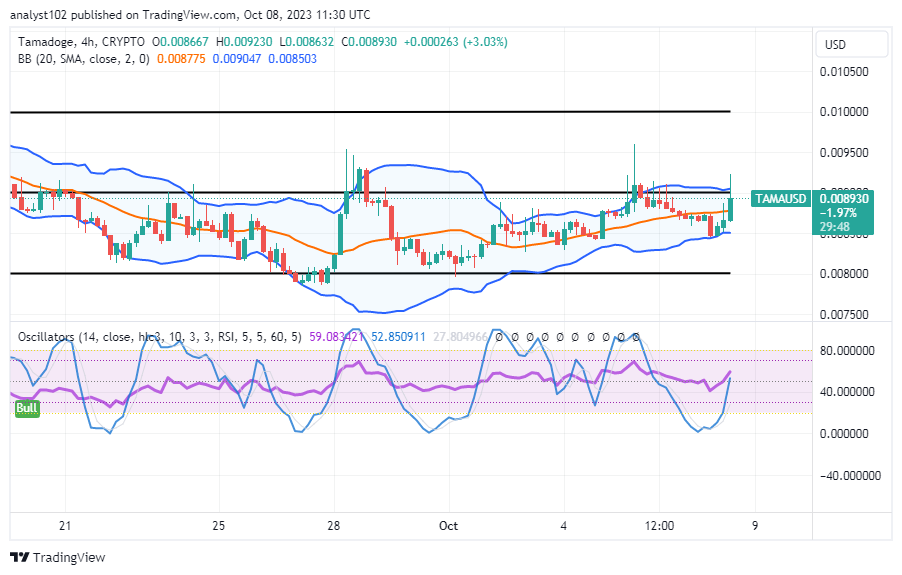
The TAMA/USD medium-term chart reveals that the crypto trade finds support around the buy signal side of the lower Bollinger band trend line, moving northward through some resistances.
The technical trade values on the Bollinger Bands show a record of $0.009047, $0.008775, as their lower part places at $0.008503. Their mode of trending connotes a tentative bullish path. The stochastic oscillators are positioned from 52.850911 to 59.083421 to indicate that forces in the moon direction have been kept to a reasonable measure.
Which trading barrier needs to be overcome sustainably to put an end to bearish actions in the TAMA/USD market operations?
As the point of technicalities is currently suggesting a relative bullishness within the Bollinger Band lines in the market transactions of TAMA/USD, long-term investors still stand a chance of deriving huge positive returns as the price finds support around the point of $0.008500, moving northward.
When entering the oversold area, buyers placing longing position orders must pay close attention to the blue line in order to stay steady and obtain favorable conditions that would favor longing entries. The market’s ups and downs will manifest themselves at both the upper and lower trend lines in the interim. Bulls should continue their strategy of buying and holding, nevertheless.
TAMA/USD Short-term chart
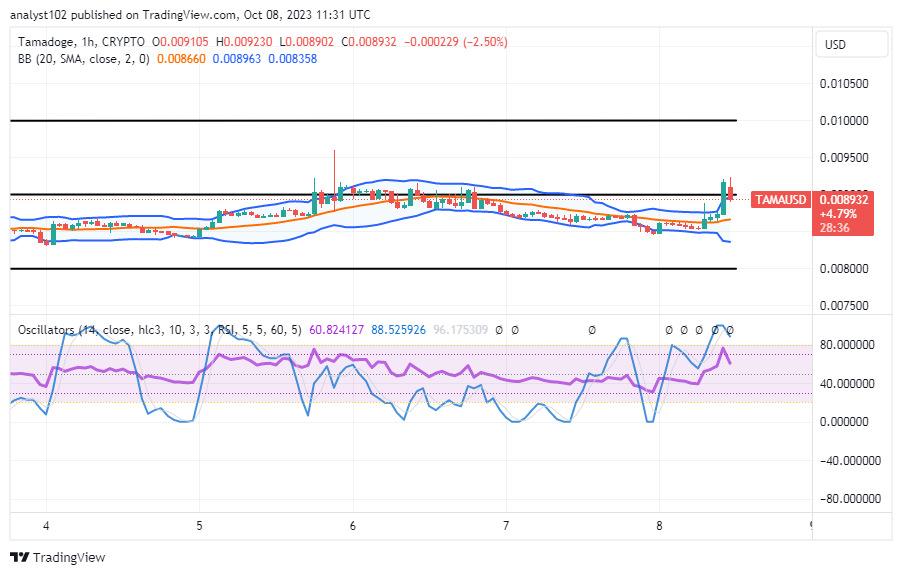
The TAMA/USD short-term chart reveals the cryptoeconomic trade finds support around the lower Bollinger Bands, moving northward through a line of barriers.
The current price line has caused the upper Bollinger Band trend line to slant upward, causing it to calculate at $0.008963, leaving the middle Bollinger Band line at $0.008660 and the lower Bollinger Band trending at $0.008358. The stochastic oscillators are currently pointing to the north and showing that the blue line is in the overbought region, indicating that it is not a good moment to take quick gains from the market.
It only takes a tap to access classic arcade games!
Play five classic games to win $TAMA right now in the Tamadoge arcade.
Classic arcade games are just a tap away! 🕹️
— TAMADOGE (@Tamadogecoin) October 8, 2023
Play to earn $TAMA across five classic games in Tamadoge Arcade now 👇
📱 Android: https://t.co/3PXpfUBjQh
📱 iOS: https://t.co/UN5MlRGOTC pic.twitter.com/MdVx3E9SQI
Do you want a coin that would 100X in the next few months? That is Tamadoge. Buy TAMA today
Note:Forexschoolonline.com is not a financial advisor. Do your research before investing your funds in any financial asset or presented product or event. We are not responsible for your investing results.


Leave a Reply