Tamadoge Price Prediction – May 29
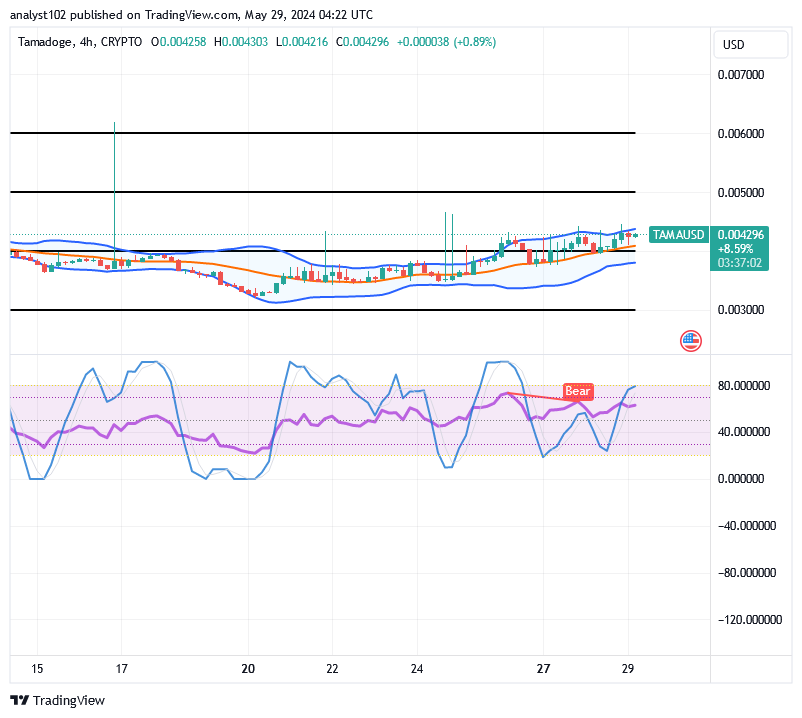
There has been good upkeep in the way that long-position pushers have been making efforts to outpace the activities of bears in the TAMA/USD market operations over a couple of sessions, as the base instrument has been seen bouncing, hovering around the value line of $0.004.
The pathway back up has been comparatively formed across the point, according to the arrangement of candlesticks from a 4-hour chart perspective. That means that the crucial support trade line will stay at the top of $0.003, and the primary resistance line will stage at $0.005. With that in mind, we strongly advise sellers to exercise caution while playing alongside most indications of a reversal of upward advances from the greater zones in the following sessions.
TAMA/USD Market
Key Levels
Resistance levels: $0.005, $0.006, $0.007
Support levels: $0.003, $0.0025, $0.002
TAMA/USD Medium-term Chart
The TAMA/USD medium-term chart shows that the crypto-economic market has been bouncing and hovering around $0.004.
The stochastic oscillators’ posture indicates negative trades signal since, as of this writing, the blue section is trying to reach an overbought area. This means that purchasing pressure may not increase much through stronger resistance in the next operations. Within the range of $0.005 and $0.003, the Bollinger Bands trend lines are in the mood to go northward.
What is the appearance of the price movements in the TAMA/USD market at the $0.005 and $0.003 points?
Those resistances and the support lines are representations of range-bound zones, emphasizing buyers are still in the mood of garnering momentum toward breaking through overhead barriers, as the TAMA/USD trade has been bouncing and hovering around $0.004.
In the near future, it is unlikely that the TAMA/USD trade will easily push against either the lower range at $0.003 or the upper range line at $0.005. However, in the long-term running mode, positions should be staked around such levels at all costs.
The TAMA/USD short-term
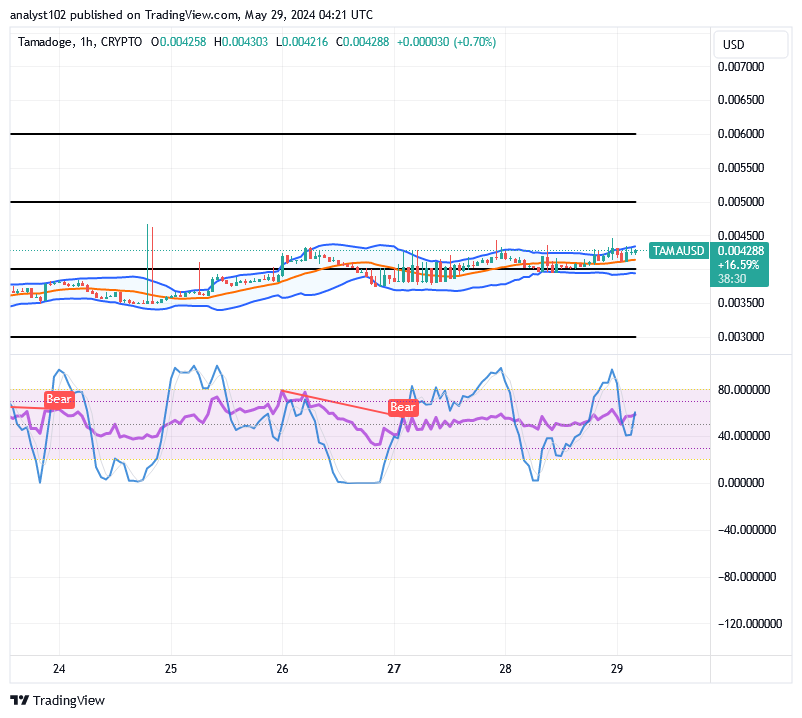
The TAMA/USD short-term chart reveals that the crypto-economic market has been bouncing in its movements, hovering around $0.004.
There is a line of lower highs in the card, as shown by the Bollinger Bands trend lines elegantly extending to the east-north. It has been observed that the stochastic oscillators are able to skew primarily upward at some moments. It is likely that buyers will receive reasonable long-term entries from the Bollinger Bands’ lower indicator.
View your ranking, compare yourself to others, and get your TAMA incentives. Recall that your share increases with your score!
Leaderboard Update! 🏆🚨
— TAMADOGE (@Tamadogecoin) May 29, 2024
Closing at Midnight UTC, make sure you’ve given it your all! 🕛
Check your rank, see how you stack up, and claim your $TAMA rewards. Remember, the higher you score, the bigger your share!💰#Tamadoge #PlayToEarn #CryptoGaming #P2E pic.twitter.com/46grzl6ujh
Do you want a coin that would 100X in the next few months? That is Tamadoge. Buy TAMA today
Note: Forexschoolonline.com it a financial advisor. Do your research before investing your funds in any financial asset or presented product or event. We are not responsible for your investing results.


Leave a Reply