Tamadoge Price Prediction – December 2
A price movement path has been materializing to demonstrate that the TAMA/USD market is having lower highs, given that the crypto-economic market presently tends to hike soon, holding a base formation at a lower spot.
The price is trading around the $0.0015442 value line, suggesting that the process that is re-energizing velocity is not in a rush to return to a big comeback in the burgeoning base crypto economy. For greater clarity, $0.001 is now a crucial fundamental support point.
Resistance levels: $0.0025, $0.0035, $0.0045
Support levels: $0.001, $0.00075, $0.0005
TAMA/USD Medium-term Chart
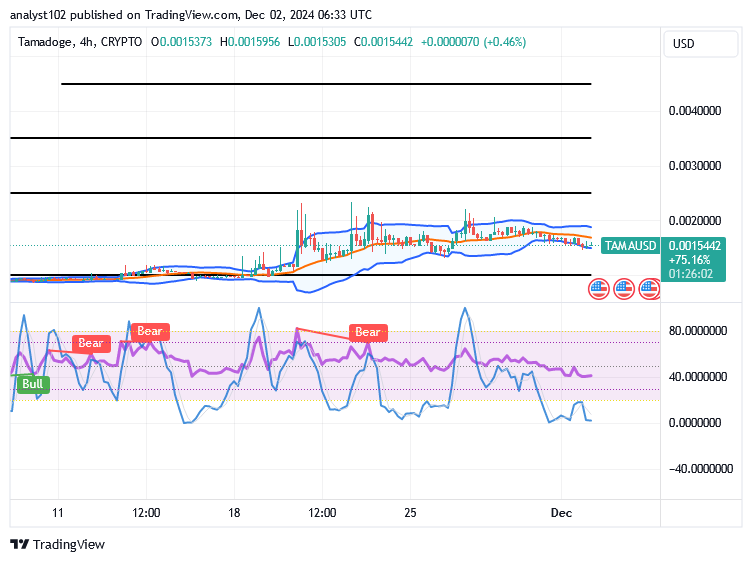
The medium-term TAMA/USD chart showcases that the crypto-economic market tends to hike in the near term, holding a base.
Since the price is maintaining a base pattern around the trend lines of the Bollinger Bands indicators, the market has been displaying a systemic style. A sequence of candlesticks that have been shown mostly bear a positive indication because there has been a brief route to the downside. The stochastic oscillators have stayed active in the oversold area for a few sessions, indicating that bears might be quickly lured into a whipsaw situation.
In the event that bulls in the TAMA/USD market are unable to withstand more retracements, where will the price drop from $0.0015442?
A previous lower-trading zone might be aiming for revisiting in the long-term running mode if the TAMA/USD market buyers fall short in their efforts to push northward back from the lower part of the Bollinger Bands, as the price tends to hike, holding a base reformation.
There is a crude way to have different candlesticks that feature southward across the Bollinger Bands indicators’ zones. Stylishly moving in a consolidation fashion, the stochastic oscillators have remained in the oversold area. Buyers or investors did not need to fret about shorting their positions in light of such events.
The TAMA/USD short-term
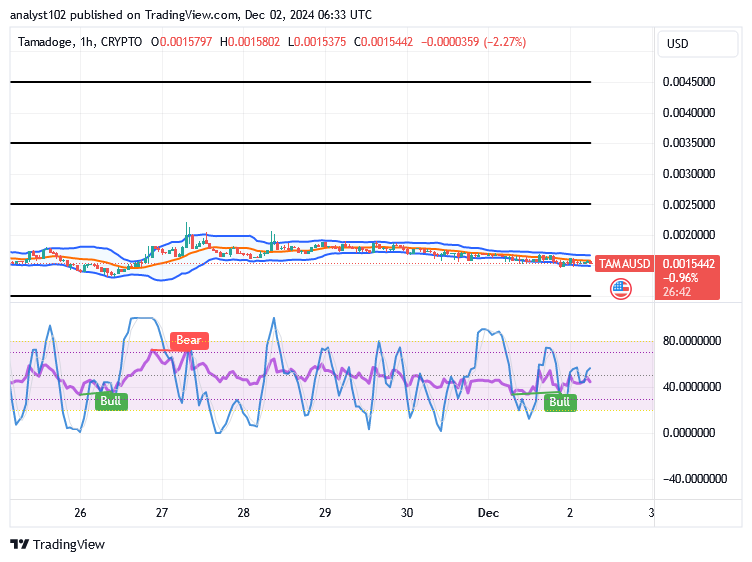
The TAMA/USD short-term chart showcases that the crypto-economic market tends to hike, holding a base setting.
The hourly setup’s stochastic oscillators currently indicate that a positive sign is likely to materialize in opposition to additional downward market movements in the upcoming sessions. In order to border some of the hourly-formed candlesticks in their lower lows and lower highs, the Bollinger Bands indicators have moved slightly to the negative side.
For this week, here is your final chance to climb the scoreboard!
The greatest TAMA return will go to the top #Tamadoge players.
This is your final chance to climb this week’s leaderboard! 🚨
— TAMADOGE (@Tamadogecoin) August 21, 2024
The very best #Tamadoge players will get the highest return of $TAMA 🎉
Download, play and earn on any of our games here 👇
📱 Android: https://t.co/10UNfVWWwB…
📱 iOS: https://t.co/yAl2FhwZTu… pic.twitter.com/IGi2KmtQiL
Do you want a coin that would 100X in the next few months? That is Tamadoge. Buy TAMA today
Note: Forexschoolonline.com is a financial advisor. Do your research before investing your funds in any financial asset or presented product or event. We are not responsible for your investing results.


Leave a Reply