Tamadoge Price Prediction – April 29
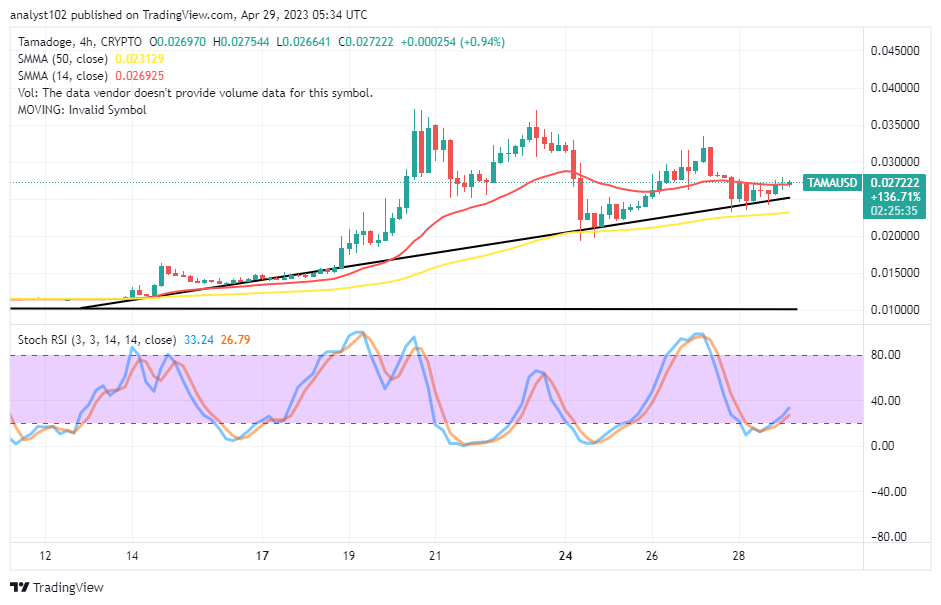
About two days back, the TAMA/USD trade suffered a correction before ending with a short-range-bound trading line, currently giving back that the crypto market is preparing for a rally. There has been a manifestation sign that buyers would have to spring northward between the trading zones of $0.026641 and $0.027544 at a minimal percentage rate of 0.94 positives. Indications are the portending resumption of up featuring than aggressive drops that will live long, backing the trending force of the US currency.
TAMA/USD Market
Key Levels
Resistance levels: $0.03000, $0.03500, $0.04000
Support levels: $0.02000, $0.01500, $0.01000
TAMA/USD – 4-hour Chart
The TAMA/USD 4-hour chart showcases the crypto-economic market preparing for a rally, capable of sustaining through a northward path over the buying signal side of the bigger SMA trend line. The 14-day SMA indicator is at $0.026925 above the $0.0223129 point of the 50-day SMA indicator. The Stochastic Oscillators have initially dipped into the oversold region, maintaining 26.79 and 33.24 levels. It shows the former trading instrument is composing energy to prevail over its counter-trading coin.
Will a session be cut short for more lows if a sudden aggressive decline motion occurs against the 50-day SMA trend line?
A sudden aggressive decline movement, tending to surface against the bigger SMA, will metamorphose into safer rebounding price action that buyers and investors will leverage upon even though the TAMA/USD market prepares for a rally at a distance at the top. The velocity motion suggests that long-position placers will possess upper hands as long as the posture of the Stochastic Oscillators keeps the northbound-pointing mode.
On the downside of the TAMA/USD technical analysis, shorting activities tend to lose out on the threshold of the 14-day SMA if trying to regain momentum. Therefore, it would be technically ideal for bearish-trading sentiments to suspend. Sellers should be cautious if the market reverses or hovers around $0.025000 because a new shorting order issued at that point in a shorter time frame could result in a false fall-off signal situation.
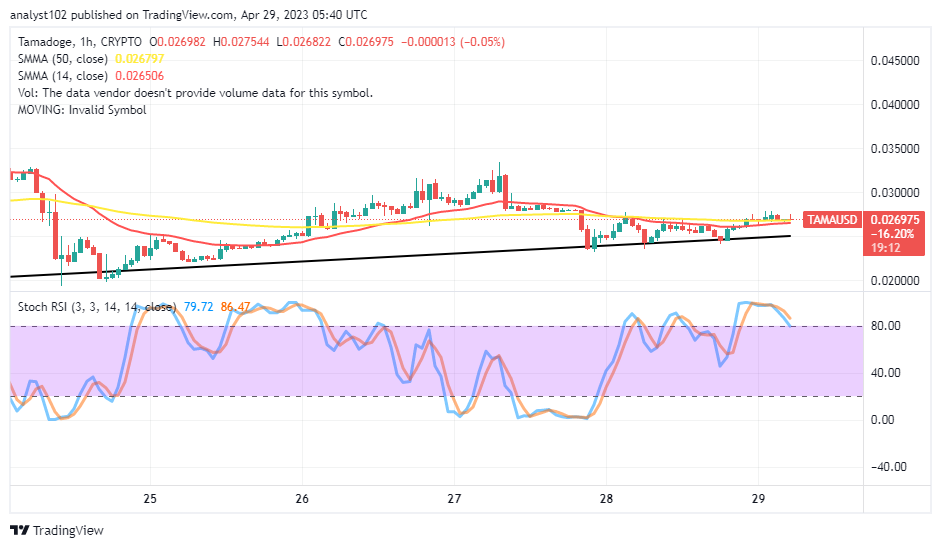
TAMA/USD 1-hour chart
The TAMA/USD 1-hour chart has shown the crypto-economic market is pushing for a rally based on the bullish trend line drawn beneath the trend lines of the SMAs. The 14-day SMA indicator is tightly trending below the 50-day SMA indicator. And they are pointing in the eastbound direction. The Stochastic Oscillators have crossed southbound in the overbought region to 86.47 and 79.72 levels. The pairing instrument’s short-term performance indicates that sellers must exercise prudence not to overstay their positions below the $0.027000 resistance.
Forget about Babydoge, TAMA is winning! In the coming days, it will be listed on top CEXs.
Do you want a coin that would 100X in the next few months? That is Tamadoge. Buy TAMA today
Note: Forexschoolonline.com is not a financial advisor. Do your research before investing your funds in any financial asset or presented product or event. We are not responsible for your investing results.


Leave a Reply