Tamadoge Price Prediction – August 20
A series of trade conditions have been prominently featured in the Tamadoge trade operations, pairing with the valuation of the US currency purchasing weight, as it has been observed that the cryptocurrency market hits a barrier closely located beneath the line of $0.01100 after surging higher from the support value of $0.006000.
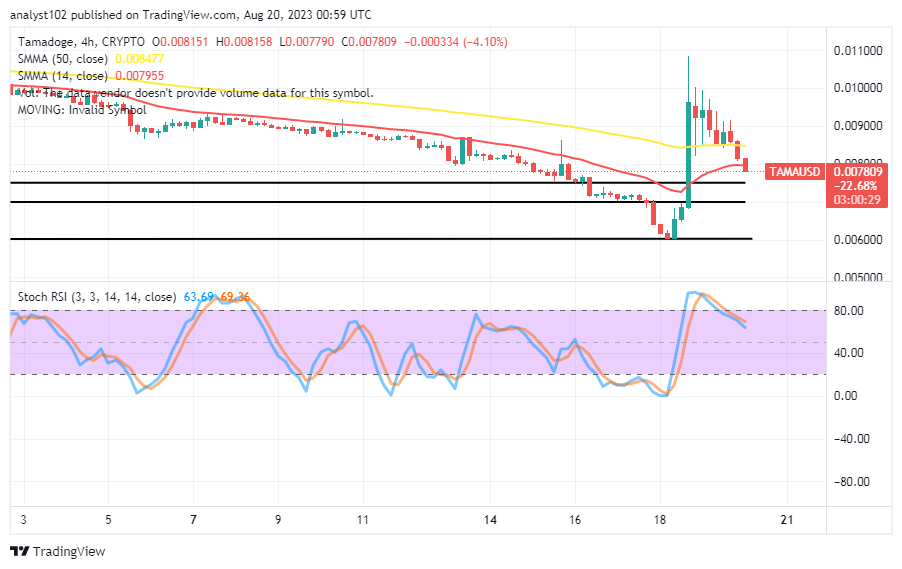
The current trade situation has led to another round of vigorous retracement movements with a significant negative percentage rate of 4.10, trading between $0.008158 and $0.007790. At the moment, purchasers might need to wait for a fair reduction sign before launching another re-launch or subsequent re-launches due to pressures driving moves to the downside.
TAMA/USD Market
Key Levels
Resistance levels: $0.009000, $0.01000, $0.01100
Support levels: $0.007000, $0.006000, $0.005000
TAMA/USD Medium-term Chart
The TAMA/USD medium-term chart showcases the crypto-economic market hitting a barrier nearing the trade resistance point of $0.01100 during last Friday’s session, surging higher after finding support at the level of $0.006000.
It would be a nicer ever situation that has made an obvious condition toward getting a reliable northward cross to occur between the moving averages’ values to ascertain a clearer cut of having a stable resumption of rises. In light of that, the 14-day SMA indicator has slightly shifted upward from underneath the 50-day SMA indicator. As a result, the 14-day SMA indicator has marginally moved higher from the 50-day SMA indicator’s bottom. The stochastic oscillators have conjoined their lines southbound from the overbought region, placing from 69.36 to 63.69, portending that devaluation pressure is ongoing.
Which support line will be the most dangerous to breach if the TAMA/USD market’s current retracement movements intensify?
Being as it is in the business operations of Tamadoge versus the US coin, the most fearful force has been witnessed around the support area where the price might have initially picked up muscles as the crypto trade hits a barrier closely below the value of $0.01100 in the recent day back, following a line of surging higher from the $0.006000.
Before placing orders for purchasing positions, it would be highly advised to wait for the stochastic oscillators to forecast the probability of getting either a pause or a state of trade affairs, suggesting pointing back to the north side, as long-position pushers are surrendering to the gravity of correction.
TAMA/USD Short-term chart
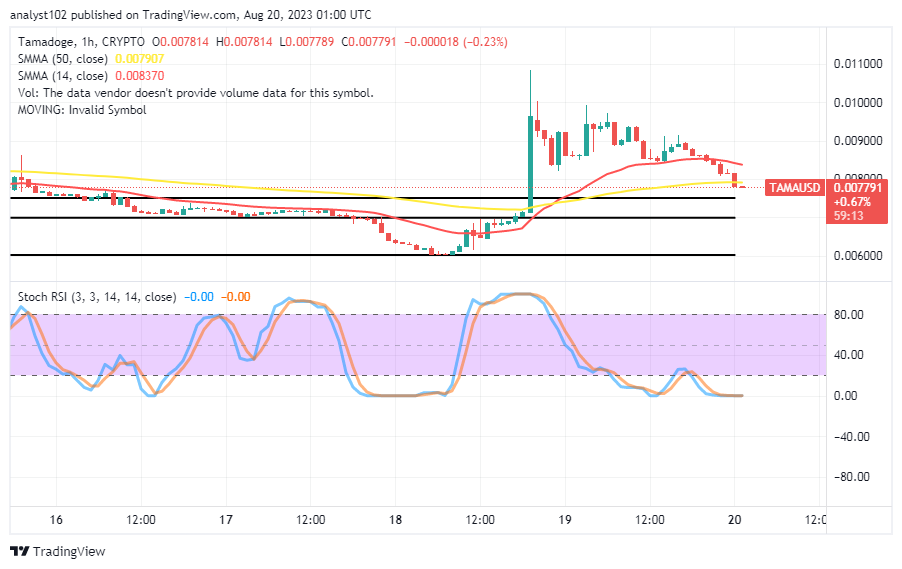
The TAMA/USD short-term chart reveals the crypto-economic market hits a barrier point closely underneath the value of $0.01100 after surging higher with a force from the support pricing zone of $0.006000 on the 18th trading session of last week.
The 50-day SMA indicator’s value line of $0.007907 is where the 14-day SMA indicator has a little southerly kink at $0.008370. The Stochastic Oscillators have moved into oversold territory in a southerly direction, maintaining negative numbers at both ends, indicating a risky time for establishing stable positions in opposition to additional decelerating movements of the base trading instrument. For newly intending investors, it would be a good time to invest and even add to positions if the transaction line will still go undervalued in the future.
Comment and let us know what your weekend plans are.
Got that Friday feeling??
— TAMADOGE (@Tamadogecoin) August 18, 2023
Comment and tell us your big weekend plans 🥳 pic.twitter.com/9y8Dxq5RkT
Do you want a coin that would 100X in the next few months? That is Tamadoge. Buy TAMA today
Note: Forexschoolonline.com is not a financial advisor. Do your research before investing your funds in any financial asset or presented product or event. We are not responsible for your investing results.


Leave a Reply