Tamadoge Price Prediction – July 17
The Tamadoge market has a bounce sign as it is extending the base setup between the trade axis of $0.01200 and $0.01000 over a long-term session.
A recurrent cycle of smaller lower lows has persisted despite having little to no chance of providing consistent resistance to any impending unimaginable upswing. For the time being, the emerging crypto-economic business has gone through a period of momentum gathering before the presumed explosion. On that bias note, investors might have to continue to hold their positions from the angle of dip, notably by using the Oscillators’ reading posture at their variant low values.
TAMA/USD Market
Key Levels
Resistance levels: $0.01200, $0.01400, $0.01600
Support levels: $0.01000, $0.00900, $0.00800
TAMA/USD – 4-hour Chart
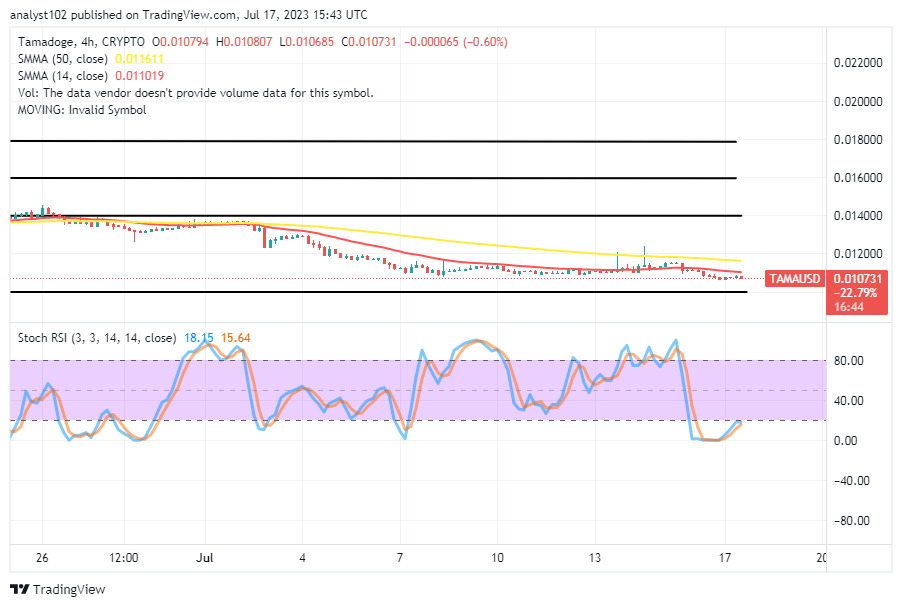
The TAMA/USD 4-hour chart showcases the crypto-economic trade with a bounce sign, extending the base setup below the points of the indicators.
It has been demonstrated that the inability of the bulls to push against some of the declination moves in the market has led to letting the 14-day SMA trend line remain below the 50-day SMA trend line. The Stochastic Oscillators are in the oversold region, trying to cross back northbound. And they are positioned at 15.64 to 18.15 to signal that the price is somewhat trying to find its way back to the upside.
Should the TAMA/USD market traders suspend their trading at this point as there haven’t been any sustained increases?
Technically speaking, it is not ideal for any investors in the TAMA/USD market operations to back out at this point as the crypto-economic business has a bounce sign, extending the base setup.
So much priority has to be placed on the reading of the Stochastic oscillators, judging by the positioning of the daily, 4-hour, and 1-hour charts, before taking a trade decision. Pluses and minuses apart, our conclusion is that new prospective investors are still waiting to join during the prime time for placing yearning orders. Jumping into a trade during a surge in volatility could result in a substantial loss if the move develops a significant reversal trend.
TAMA/USD 1-hour chart
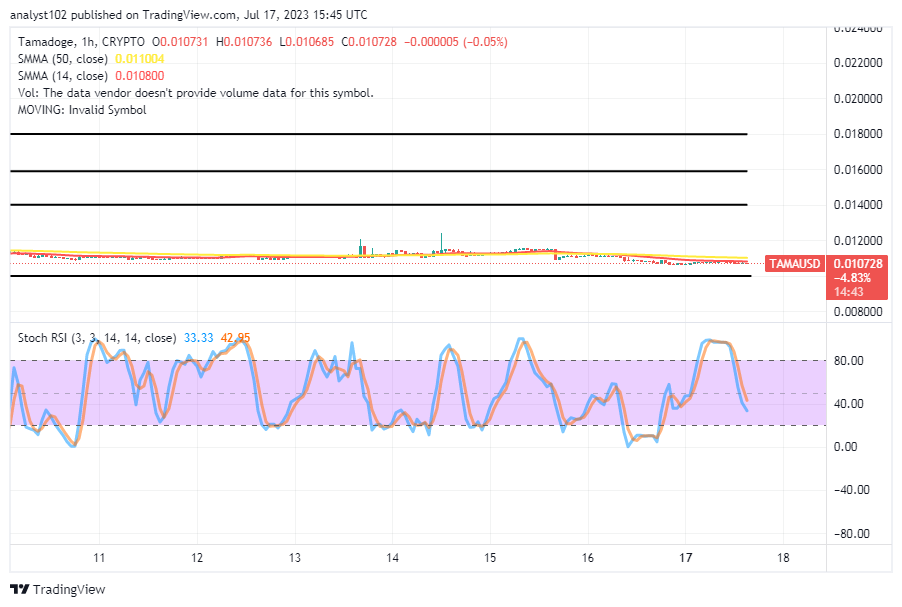
The TAMA/USD 1-hour chart reveals the crypto trade has a bounce sign, extending the base setup around the eastward-conjoining mood of the trading indicators.
The 14-day SMA is closely positioned beneath the 50-day SMA, creating a lighter spacing between the indicators. Candlesticks have been prominently displayed in a flutter impulse that has been closely centered on the smaller Moving Average’s sell signal side. The Stochastic Oscillators have moved southward from the overbought area to 42.95 and 33.33 points, indicating that buyers are starting to ease up a bit. However, the current bargaining price is regarded as low and is advantageous to accept.
We’ve been working hard to add yet another fantastic (pun intended) feature to the Tamadoge Arcade. Here is a preview:
👾NEW GAME ALERT👾
— TAMADOGE (@Tamadogecoin) July 17, 2023
Our team has been hard at work to bring you yet another stellar (pun intended…😉) addition to the Tamadoge Arcade 🤩
Here’s a sneak peak 👀 pic.twitter.com/NcXhIFRQSr
Do you want a coin that would 100X in the next few months? That is Tamadoge. Buy TAMA today
Note: Forexschoolonline.com is not a financial advisor. Do your research before investing your funds in any financial asset or presented product or event. We are not responsible for your investing results.


Leave a Reply