The USD/CAD seems to have witnessed some favorable fundamentals. Consequently, this has caused the pair to gain some upside traction, and it now trades at 1.3786. Will the form continue? Let’s further analyze this market for more insight.
Major Price Levels:
Top Levels: 1.3800, 1.3820, and .3850
Floor Levels: 1.3786, 1.3750, and 1.3732

USD/CAD Price Action Breaks Through, Yet Look Ready for More Moves
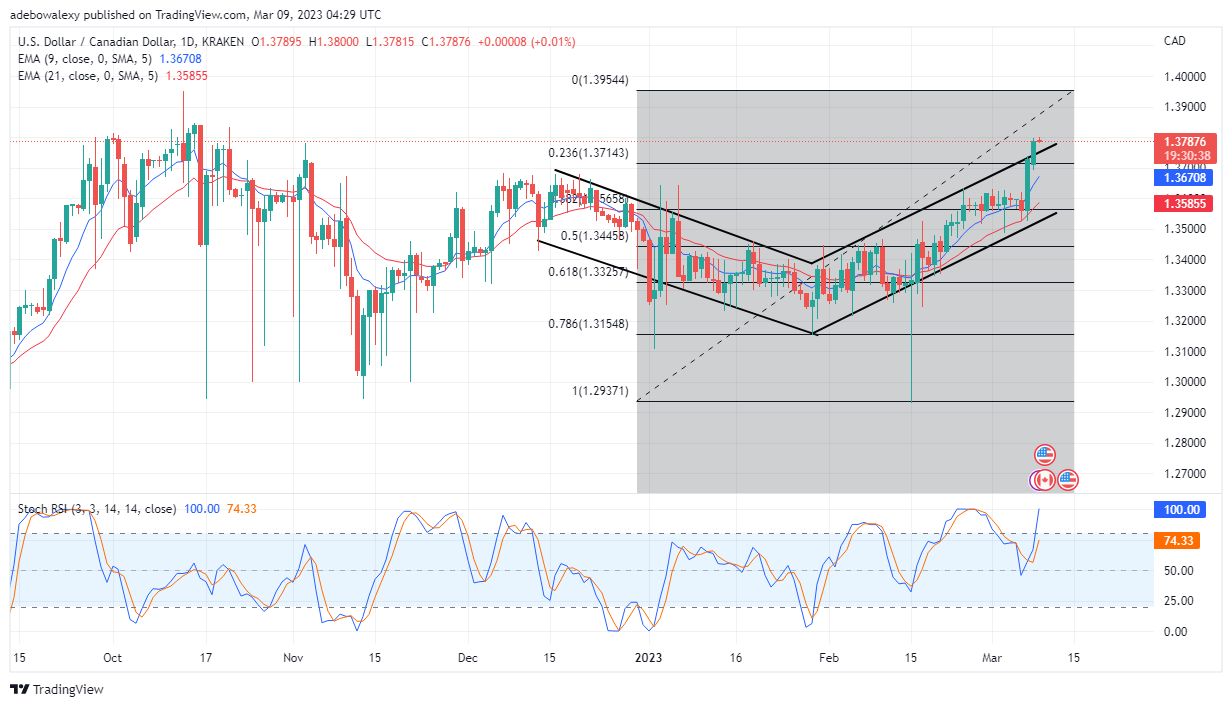
Price action on the USD/CAD daily market has suddenly increased in its upside momentum. The pair’s price action broke through the Fibonacci Retracement resistance level of 23.60 and reached further upwards to 1.3789. Afterward, a tiny red price candle appeared on this market, which indicates a minimal effect of headwind. Meanwhile, the RSI indicator seems to be revealing that the upside momentum is still growing. The inference mentioned could be observed as the lines of the applied Stochastic RSI indicator stays steeply projected upwards. Therefore, it appears prices may still move upward in this market.

USD/CAD Price Action Seems Ready to Break Further Upwards
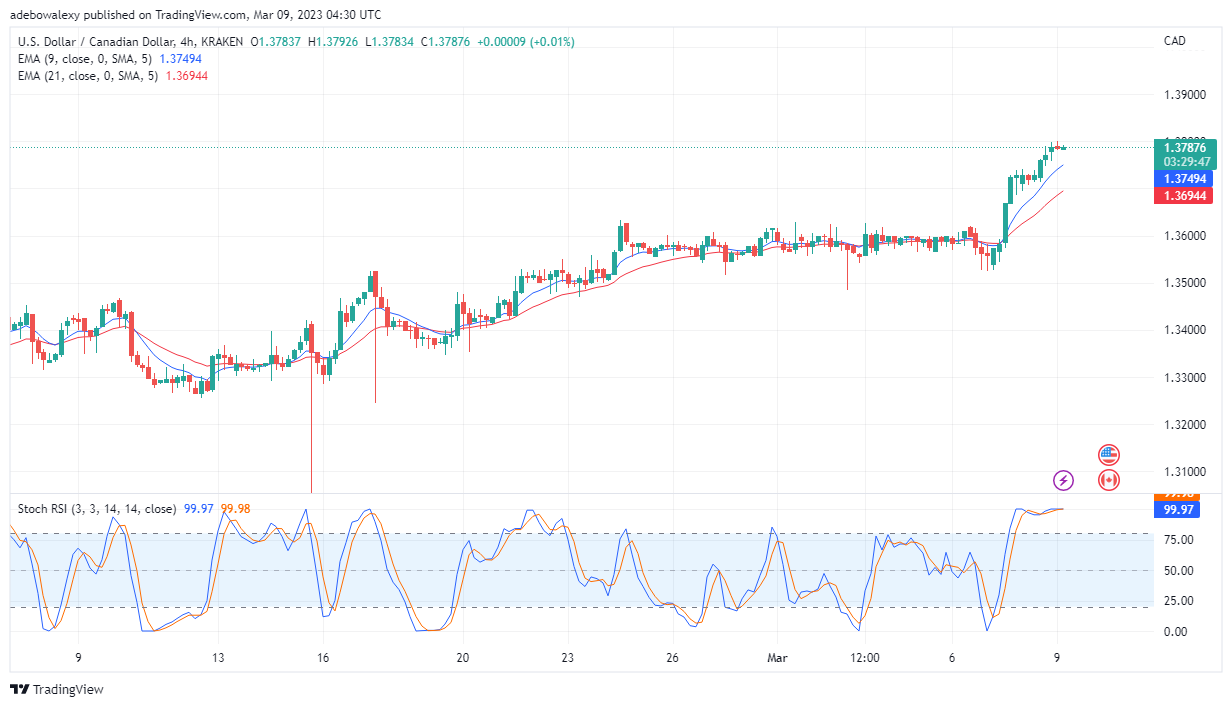
It appears that the favorable fundamentals witnessed in the USD/CAD market haven’t lost their effectiveness. This could be observed as another trading session has started in favor of the bulls on the 4-hour market. However, one will notice a significant decrease in the size of the price candles, which portrays a reduction in upside momentum. Likewise, the RSI indicator lines are now merged at roughly the 100 mark. Nevertheless, since price activity is still above the 9- and 21-day EMA lines, traders may still hope that the price may keep moving upwards, perhaps towards 1.3830.
Do you want to take your trading to the next level? Join the best platform for that here.


Leave a Reply