Quant Price Forecast: November 6
The QNTUSD price is increasing suggesting that the investors have regained confidence in the market. The coin may likely increase further, provided buyers don’t give up and increase their buying momentum in the market. In case buyers manage to break up the pattern’s resistance trend line at the $112.43 high value, a possible relief rally may drive the coin market price to rally up to the $116.00 resistance mark and beyond, which indeed will be a turnaround for the coin holders.
Key Levels:
Resistance Levels: $101.00, $102.00, $103.00
Support Levels: $90.00, $89.00, $88.00
QNTUSD Long-term Trend: Bullish (Daily chart)
The Quant price is bullish on the higher time frame. The price bar can be seen above the moving average and this may rally up to the upper resistance level as the bulls took to their stand to be relevant in recent times.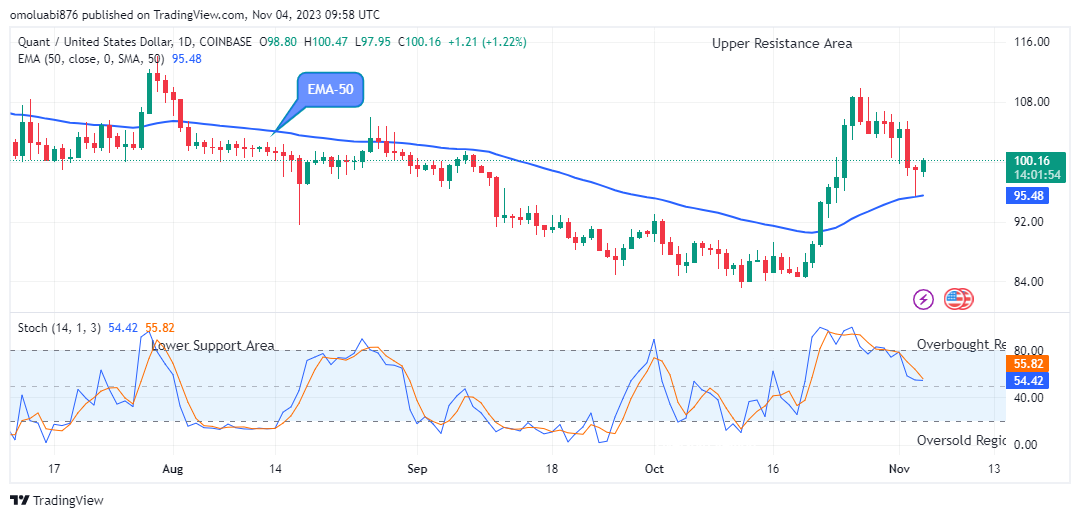
The high order flow from the bulls to the $105.32 on the 1st of November also added to this bullishness. However, the bulls are now set to further rally up the coin price to the upper resistance zone.
After completing the low dips by the short traders at the $95.45 low value, Quant buyers made a corrective move to a $100.47 high level above the EMA-50 as the daily session opens today, this indicates an uptrend in the context of the strength of the market and gives room for a more bullish impact in the market at the moment.
The long-term traders can grab this short bullish upswing to the overhead resistance, but the fate of QNTUSD’s near future price depends on the range breakout.
Adding to this, there is a tendency for the coin to rise further, if the support level holds, this will enable buyers to take the crypto price and rally up to a high of $116.00 soon in its long-term perspective.
QNTUSD Medium-term Trend: Bearish (4H chart)
The momentum on the medium-term outlook looks bearish but it is starting to rally up and turn bullish as can be seen from the chart now. 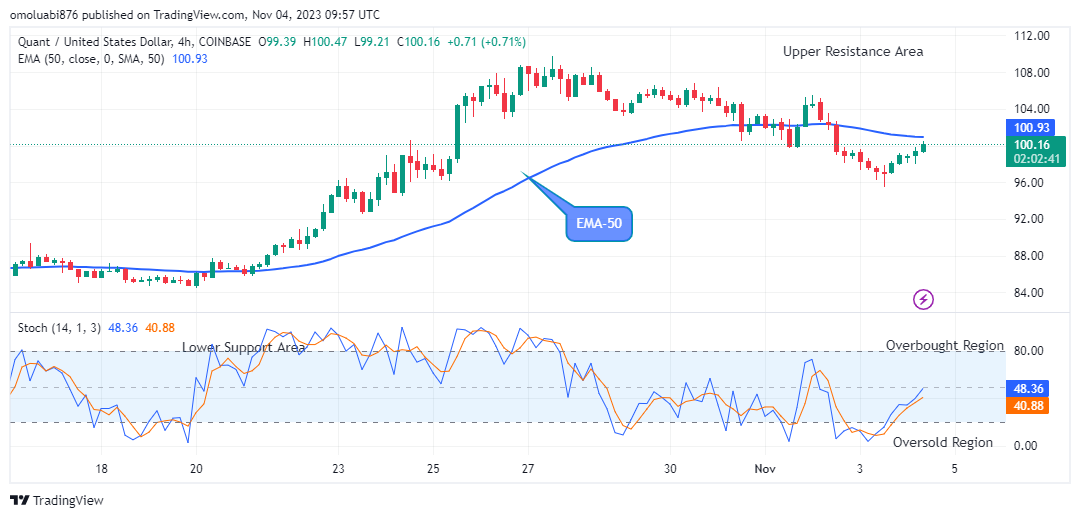
The price of QNTUSD is currently trading at the resistance close to the EMA-50. So it seems likely that the bulls are about to take over and rally up to the overhead resistance soon.
The price drop to the $94.45 low value during the previous action has made the coin price trade below the supply levels in its recent low.
The bulls caused a rise to a $100.47 high level below the EMA-50 shortly after the commencement of the 4-hour chart opens today. Thus, buyers need to add more pressure to their activities to move the market beyond the current price level.
Therefore, a 4-hour candlestick closing above the $109.81 high mark is important to confirm a bullish breakout.
Similarly, the price signal which is pointing upwards indicates that the trend will remain in an uptrend, if buyers should intensify their tension in the market and the prices rally up above the current resistance trend line, a bullish trend continuation to the overhead resistance of $116.00 is possible soon in the medium-term outlook time frame.
Place winning Quant trades with us. Get QNT here
Learn to Trade Forex Online
Quant (QNTUSD) Price to Rally up to the $116.00 Level
Footer

ForexSchoolOnline.com helps individual traders learn how to trade the Forex market
WARNING: The content on this site should not be considered investment advice and we are not authorised to provide investment advice. Nothing on this website is an endorsement or recommendation of a particular trading strategy or investment decision. The information on this website is general in nature so you must consider the information in light of your objectives, financial situation and needs.
Investing is speculative. When investing your capital is at risk. This site is not intended for use in jurisdictions in which the trading or investments described are prohibited and should only be used by such persons and in such ways as are legally permitted. Your investment may not qualify for investor protection in your country or state of residence, so please conduct your own due diligence or obtain advice where necessary. This website is free for you to use but we may receive a commission from the companies we feature on this site.
We Introduce people to the world of currency trading. and provide educational content to help them learn how to become profitable traders. we're also a community of traders that support each other on our daily trading journey
Forexschoolonline.com is not a financial advisor. Do your research before investing your funds in any financial asset or presented product or event. We are not responsible for your investing results.
Leave a Reply