Quant Price Forecast: March 27
The QNTUSD price is very likely to face the positive side and might possibly retest the $28.520 supply level soon after completing the dip lows. Thus, the trapped positive momentum might be released if the coin price could break up the $215.10 resistance level. The upcoming bullish pattern may push the price to the $400.00 resistance mark and beyond.
Key Levels:
Resistance Levels: $200.20, $200.30, $200.40
Support Levels: $108.00, $107.00, $106.00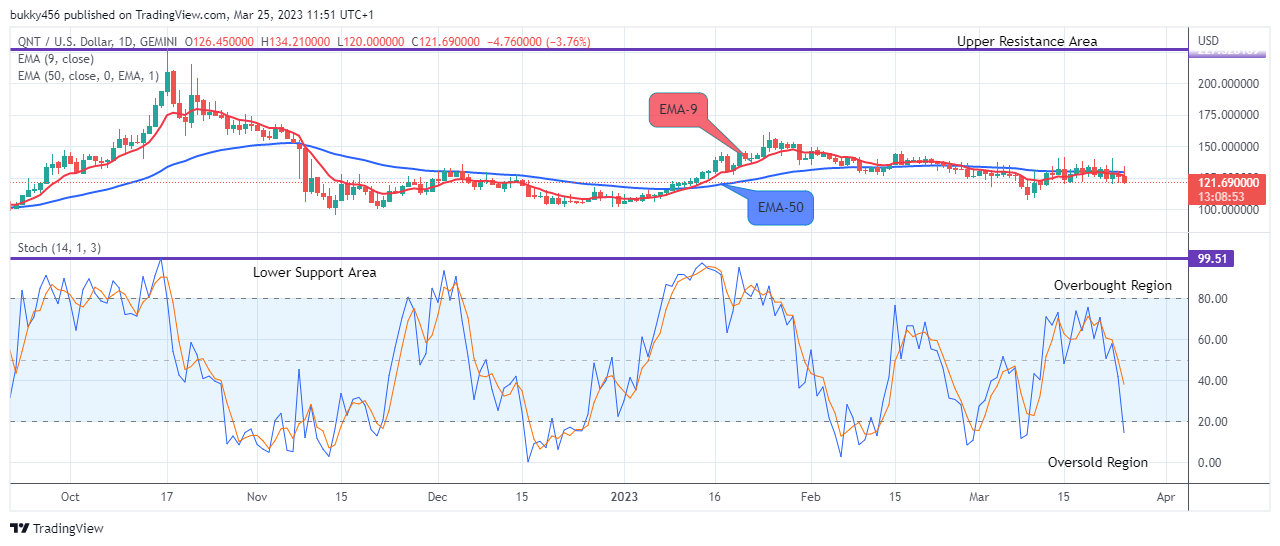
QNTUSD Long-term Trend: Bearish (Daily chart)
Quant price is in a bearish market at the moment in the higher time frame, this is because the sell traders are now involved in the order flow. Further, the price action can be seen below the two moving averages. Thus, the current trend will soon be hibernated as the market is oversold.
The bears’ pressure on the coin to $120.71 during yesterday’s session has led to a drop in the price below the supply trend levels in its recent low.
The price responded to the shift in the market structure and is currently below the moving averages at the $120.00 support value as the daily chart resumes today. However, long traders can join the market or invest in the crypto with the current trend and buy at a lower rate for more gains in the future. This will reflect an increase in the trend momentum.
Hence, should the bulls exchange hands with the sell traders and close above the $215.10 resistance value, additional intraday gains would be recorded for the buy investors.
Additionally, a rise in the upcoming rally and break above the $215.10 high value may turn around the market price of QNTUSD and the recovery pattern might possibly increase to retest the $228.52 supply level which may further extend the coin price to the $400.00 high trend level in the days ahead in its higher time frame.
QNTUSD Medium-term Trend: Bearish (4H chart)
The Quant price seems to have pullback a little but the overall trend is still bearish in its medium-term outlook. The price in green can be seen below the two EMAs, indicating a bearish trend.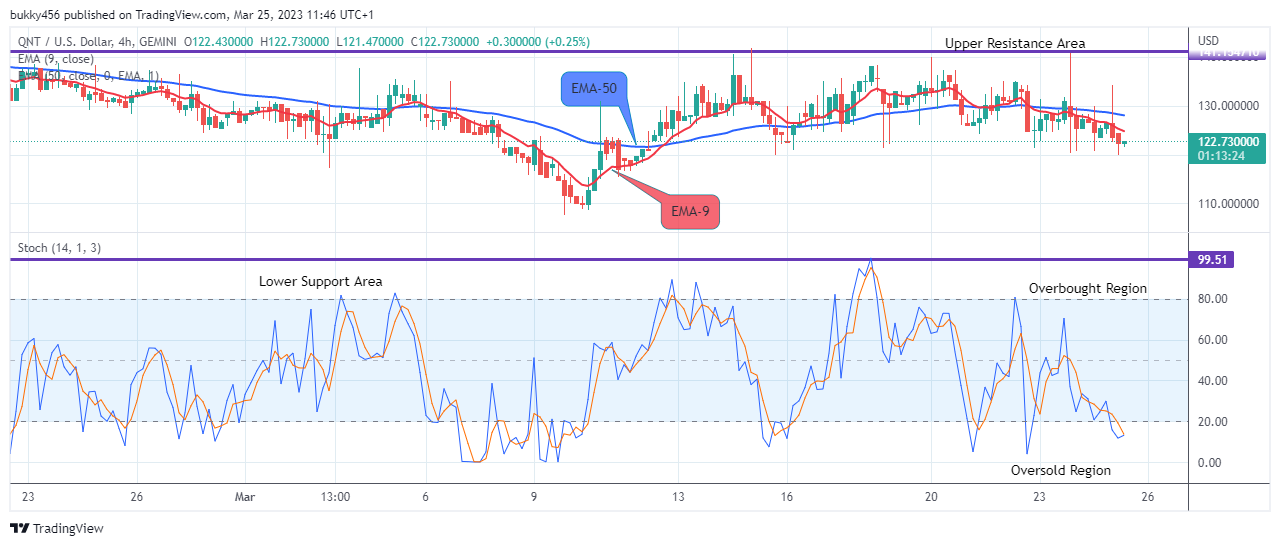
The price drop to the $120.73 low value during the previous action has made the coin price trade below the supply levels.
Earlier today the coin buyers responded to the market after a series of low-dips in the previous action and break out from the support trend line to a high at the $122.73 supply value below the two EMAs; this is an indication that the bulls are returning gradually for an increase in the coin price and to command the QNTUSD’s price actions. This will give room for the buy investors to influence the price tendency. Thus, a break above the $140.48 high mark would intensify the buying pressure on the crypto.
Next, more upsides are possible as shown by the price indicator pointing upwards; it means that the buying pressure may likely continue, in light of this, the market value of Quant might possibly retest the $228.52 previous high to hit the $400.00 upper resistance value in the days ahead in its medium-term outlook.
Place winning Quant trades with us. Get QNT here
Learn to Trade Forex Online
Quant (QNTUSD) Price Might Possibly Retest the $228.52 Supply Level Soon
Footer

ForexSchoolOnline.com helps individual traders learn how to trade the Forex market
WARNING: The content on this site should not be considered investment advice and we are not authorised to provide investment advice. Nothing on this website is an endorsement or recommendation of a particular trading strategy or investment decision. The information on this website is general in nature so you must consider the information in light of your objectives, financial situation and needs.
Investing is speculative. When investing your capital is at risk. This site is not intended for use in jurisdictions in which the trading or investments described are prohibited and should only be used by such persons and in such ways as are legally permitted. Your investment may not qualify for investor protection in your country or state of residence, so please conduct your own due diligence or obtain advice where necessary. This website is free for you to use but we may receive a commission from the companies we feature on this site.
We Introduce people to the world of currency trading. and provide educational content to help them learn how to become profitable traders. we're also a community of traders that support each other on our daily trading journey
Forexschoolonline.com is not a financial advisor. Do your research before investing your funds in any financial asset or presented product or event. We are not responsible for your investing results.
Leave a Reply