NZDUSD Analysis – Bears Continue to Drive the Price to Lower Levels
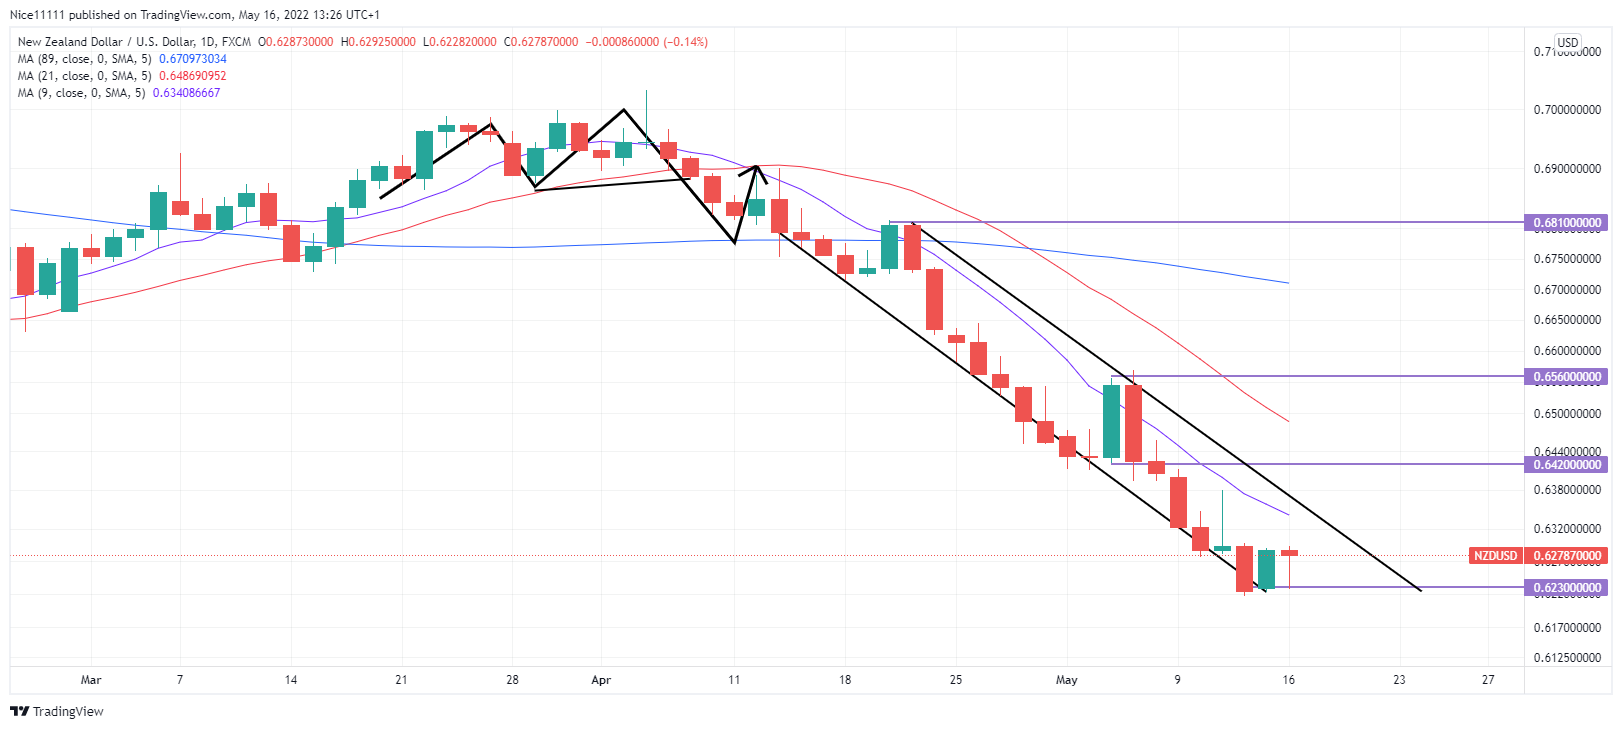
NZDUSD bears have continued to drive the market low since April. The market trend changed from bullish to bearish after a significant double top reversal pattern formed on the daily chart. The Moving Averages period nine and twenty-one gave early signals of the market reversal. On the 12th of April, a bullish daily candle formed to test the neckline of the double top. The Moving Average period nine (purple) crossed the Moving Average period twenty-one (red) to the downside.
NZDUSD Major Zones
Resistance levels: 0.6810, 0.6569
Support levels: 0.6420, 0.6230
The market has been bearish since the confirmation of the Moving Average cross on the daily chart. The price has continued to drop continuously in the market. There is massive displacement towards the downside. The market has formed a very steep slope due to the pull of the bears. The Moving Average periods nine and twenty-one eventually crossed to signify the overall market was very bearish.
The bulls attempted to create a reversal twice in the market but failed. A bullish candle was formed on the 22nd of April. The market was so weak that the bulls couldn’t sustain the upward move. The market crashed heavily. The bulls made another attempt early in May. The price rose 0.656 with a day that closed upward. As the bullish candle smashed into the Moving Average Period nine, the market purged further.
 Market Expectations
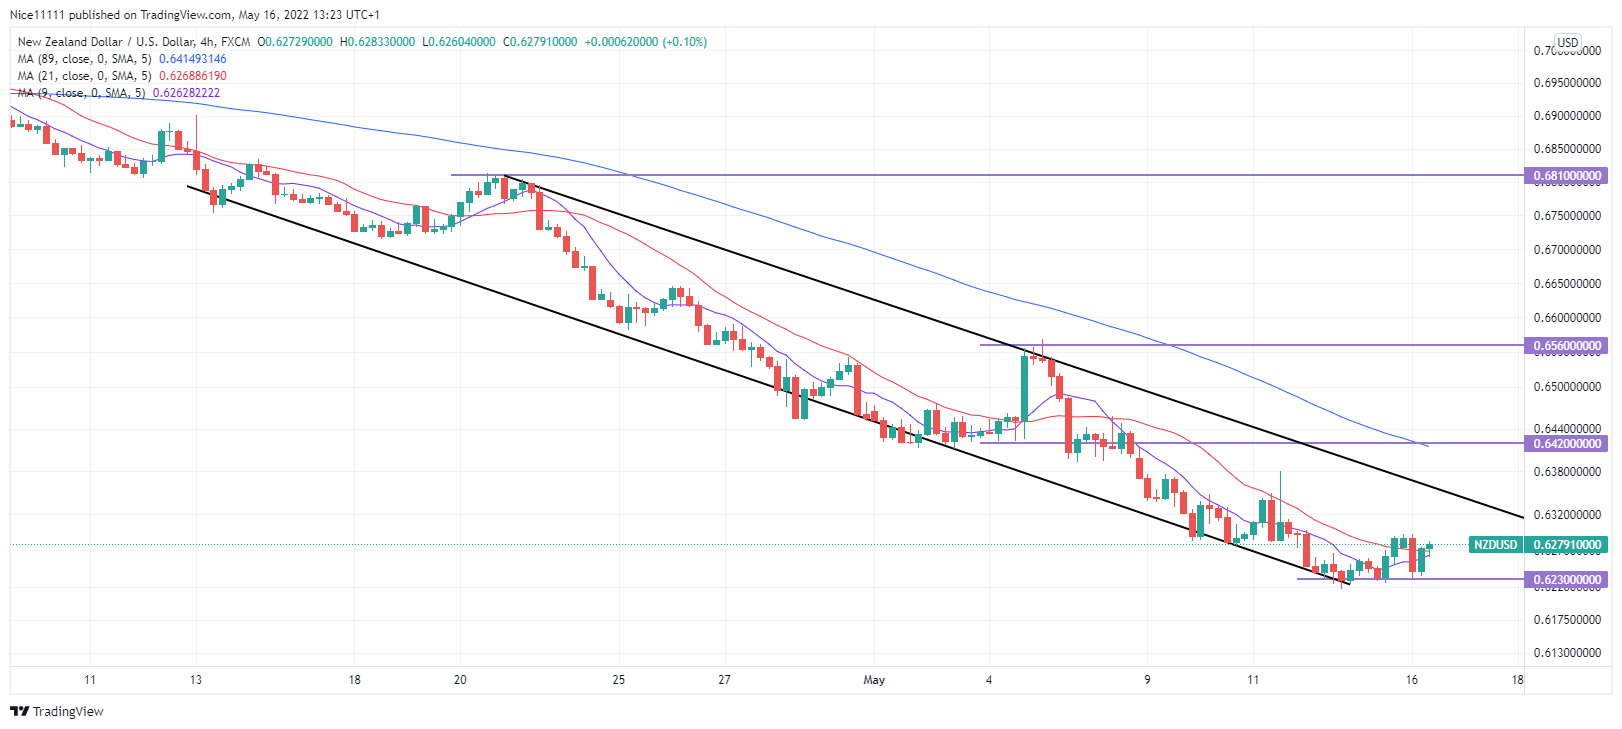
The market has not revealed any significant signs of reversal. There is currently little consolidation on the 4-hour chart at the 0.6230 demand zone. The market is likely to bounce up towards 0.6420 to the resistant trend line to continue the bearish run.
Note: Forexschoolonline.com is not a financial advisor. Do your research before investing your funds in any financial asset or presented product or event. We are not responsible for your investing results.


Leave a Reply