Lucky Block Price Prediction – July 6
LBLOCKUSD‘s potential recovery may break up at the $0.0001099 price level to validate the upcoming bullish thesis. In case the market sentiment takes a bullish turn and continues, a break above the $0.0001099 high value will signal a buy trade, which in return will intensify the buying momentum to reach the $0.0001200 upper high channel, indicating a high conviction in buyers.
Key Levels:
Resistance levels: $0.0000400, $0.0000450, $0.0000500
Support levels: $0.0000150, $0.0000100, $0.0000050
LBLOCKUSD Long-term Trend: Bearish (Daily Chart)
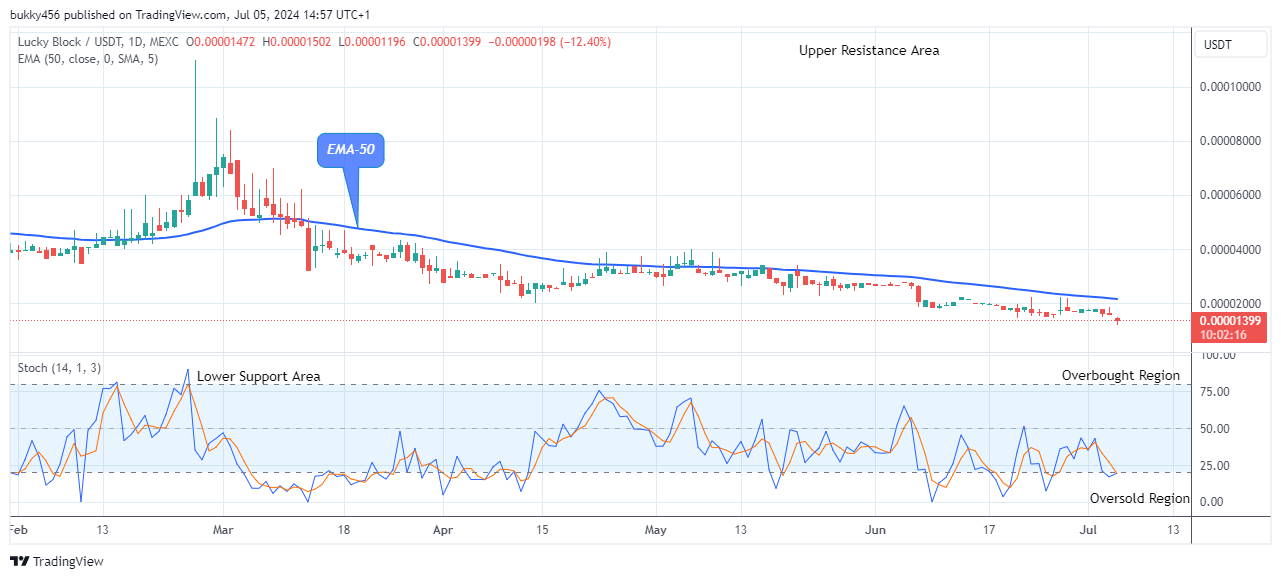
On the long-term outlook, the LBLOCKUSD pair may break up the resistance levels after updating the lows on the higher time frame. The coin is trading below the EMA-50, confirming its bearishness.
The cryptocurrency price has been trading below supply trend levels since its most recent low, owing to ongoing bearish pressure over the last few days. However, the coin is ready to break up its previous high level following the exhaustion of the selling pressure.
Today, actions from the bears drop the Lucky Block price to a low of $0.0000119 with a pin bar bearish candle value below the supply levels as the 4-hourly chart begins, indicating a possible trend reversal from the current support.
Hence, if the bulls increase their buying efforts, the price of Lucky Block may reverse at the indicated support and turn positive to break up at the previous high of $0.0001099 level, offering an additional edge to market bulls.
Further, the LBLOCKUSD price is likely going to experience a reversal and a break up at $0.0001099 is imminent soon as the market remains in an upward trend in the oversold territory of the daily stochastic; it means that the selling pressure is not likely anymore.
Thus the emergence of the buy traders is crucial at the moment, and this may break up the $0.0001099 level and expose to the $0.0001200 upper resistance in the days ahead in its higher time frame.
LBLOCKUSD Medium-term Trend: Bearish (4H Chart)
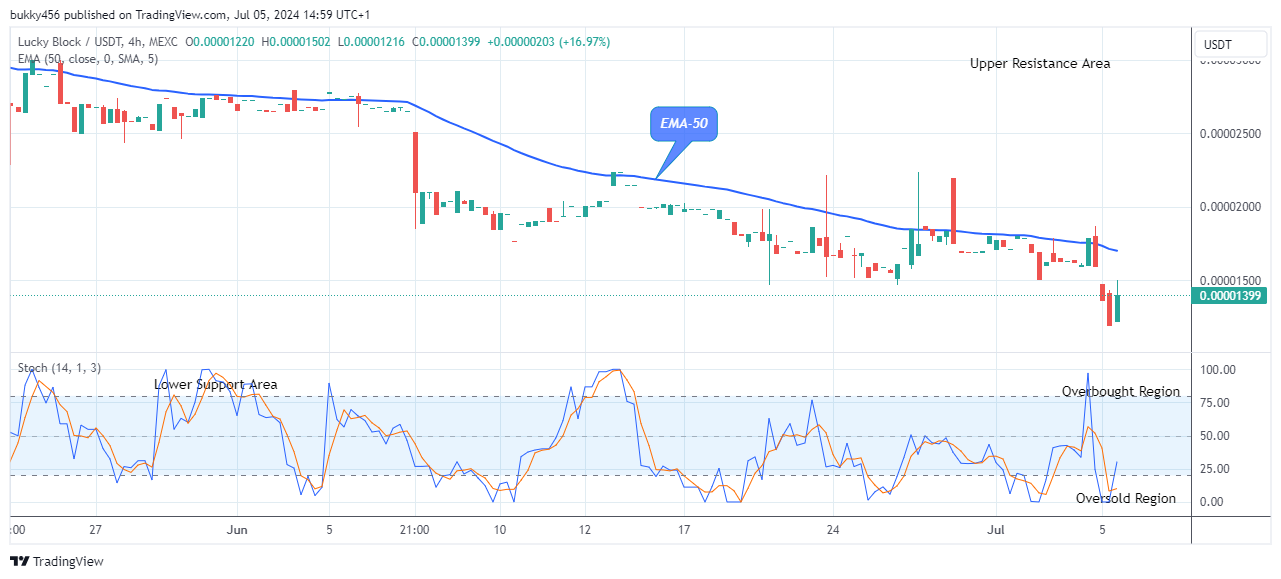
The momentum on the medium-term view appears gloomy, but it is beginning to become positive, as evidenced by the chart below. The price of LBLOCKUSD is currently trading at resistance near the EMA-50. So, it appears bulls are poised to break up at the previous resistance level and soon take control of the coin market.
The sustained bearish pressure at the $0.0000136 support value has made the crypto price drop below the supply levels in its recent high point. However, the bulls are set to break up the coin price to its new resistance trend levels.
Today’s 4-hourly chart shows the coin Lucky Block price facing resistance and trading at the $0.0000150 correction level. However, traders may seize this opportunity to buy the coin at a lower rate for more gains in the future.
Furthermore, if the bulls intensify their tension in the market, the price trend might break up the $0.0000291 crucial level, offering an additional edge to the coin buyers.
In addition, the Lucky Block market is showing more upside possibility as shown by the daily stochastic pointing upwards; therefore, more gains and strength are expected from the asset to break up at the $0.0000291 level, exposing the coin to hit the $0.0001200 upper resistance level in the coming days in its long-term perspective.
You can purchase Lucky Block here. Buy LBLOCK


Leave a Reply