Lucky Block Price Prediction – September 9
The Lucky Block bulls are attempting a recovery rally, anticipating the coin price to accelerate more, resulting in an opportunity for the coin investors. It is time for the LBLOCKUSD to grow again. The coin market has been above the supply levels in the previous action, and from the look of it, it will keep growing. The bull race may likely continue into the key psychological level of $0.0000450 barrier strength and beyond before we see any signs of interference from the sell traders if the buy traders should put more aggression into the market. Hence, the target might be the $0.0001200 upper resistance level, indicating a potential gain for the investors.
Levels:
Resistance levels: $0.0000250, $0.0000260, $0.0000270
Support levels: $0.0000168, $0.0000165, $0.0000163
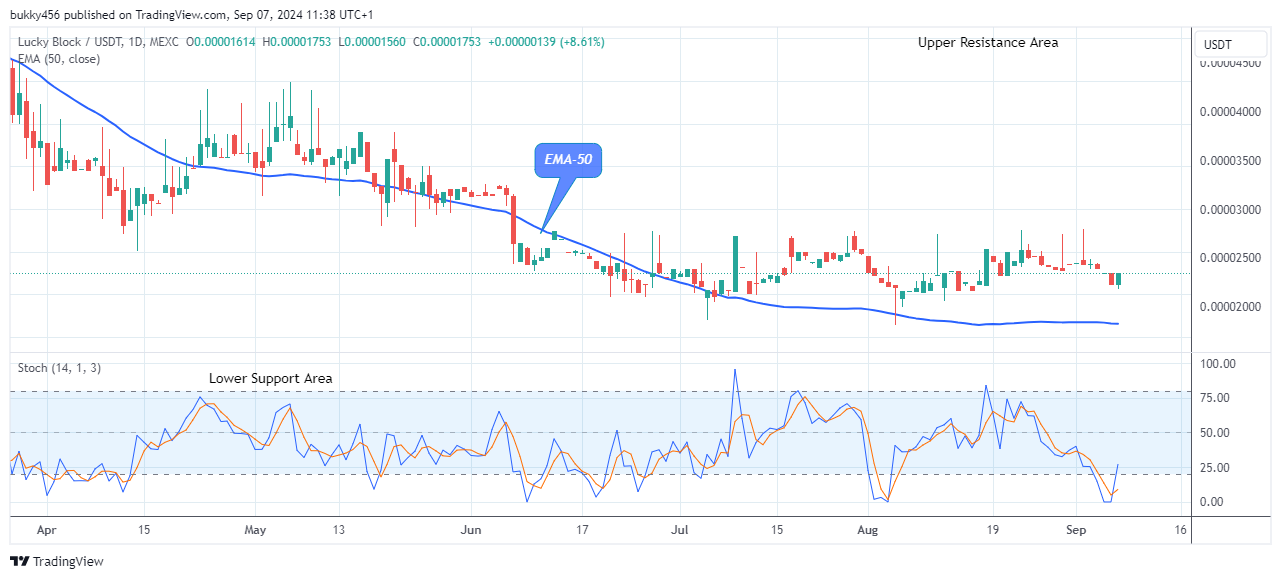
LBLOCKUSD Long-term Trend: Bullish (Daily Chart)
The LBLOCKUSD price is likely to accelerate more and an opportunity to go long for the coin traders, as the coin price loses bearish momentum and moves above the resistance level, suggesting a bullish momentum in the long-term perspective. 
The bulls’ increase in momentum at the $0.0000170 supply value in the past few days has enabled the Lucky Block price to accelerate further and stay strong above the resistance lines in its recent high.
As a result of price rejection in the previous action, the LBLOCKUSD price has accelerated more to a $0.0000175 high mark above the moving average line as the daily session opens today.
LBLOCKUSD is trading above the moving averages on the daily chart; if bulls should increase their price action and bullish momentum is sustained above the $0.0000450 high level, the cryptocurrency will further increase towards the upper resistance zone, attracting more buyers to the crypto market.
Next, the Lucky Block pair will accelerate more, as indicated by the daily signal pointing up. In light of this, the coin price might grow higher to reach the $0.0001200 supply value in the coming days as the journey up north continues in its long-term outlook.
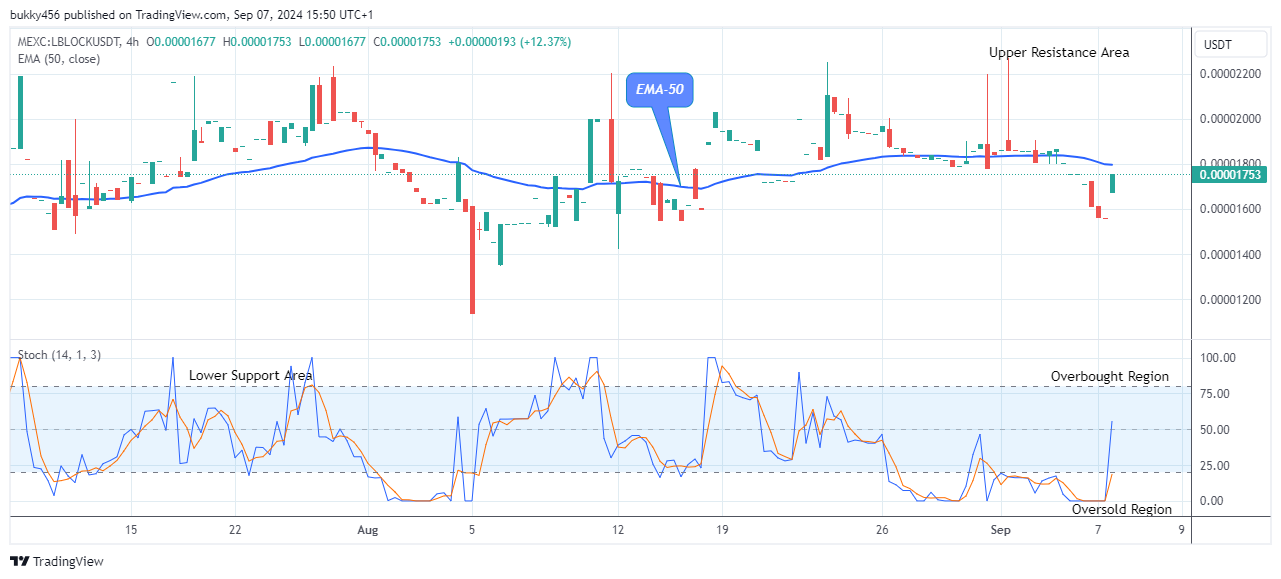
LBLOCKUSD Medium-term Trend: Bearish (4H Chart)
The medium-term chart shows that the LBLOCKUSD price will accelerate more as it travels north. The coin price is below the moving average, indicating a bearish trend. 
Actions from the short traders at a $0.0000161 low value during the last session have dropped Lucky Block’s price beneath the supply trend lines in its recent price level.
Today’s 4-hourly bullish candle at the $0.0000175 below the moving averages is a pullback, confirming the bulls’ return to the market. This breakup may accelerate the bullish momentum and extend the ongoing correction to a higher level.
Meanwhile, further upsides are likely as indicated by the price indicator pointing upwards, indicating that the LBLOCKUSD price will accelerate more, and in this case, the bullish correction pattern might extend the coin price to the $0.0001200 upper resistance value in the days to come in the medium-term outlook.
You can purchase Lucky Block here. Buy LBLOCK


Leave a Reply