A lot of traders either don’t have the time to trade the daily charts or because of their location they cannot be at the charts for the daily close.
Some traders have to be at work, others have to study and some are sleeping because it is the middle of the night when the daily charts close.
Some traders just want to make more trades using smaller time frames.
Because of this, finding and using successful intraday trading systems can be incredibly handy for a lot of traders.
In this lesson I go through six intraday trading systems you can learn and use right now. These systems can be used on all of the smaller time frames such as the 4 hour, 1 hour and 15 minute charts.
Some of these strategies are more advanced than others and you don’t need to know them all.
Often the best way is to find a strategy you like the best and then master it first before adding further strategies into your trading arsenal.
Using Major Support and Resistance
This is one of the most common intraday trading methods and also one of the easier methods to finding and playing intraday trades.
This is also a strategy we discuss a lot on this site and have a lot of lessons discussing in more length exactly how you can go about it.
When looking to use the major daily support or resistance levels to find trades you don’t have to be at the daily charts close, but you are using the daily charts.
The daily charts are incredibly powerful when used to find major areas of support and resistance. After we have marked our major support and resistance levels, we are then watching the price action around these levels.
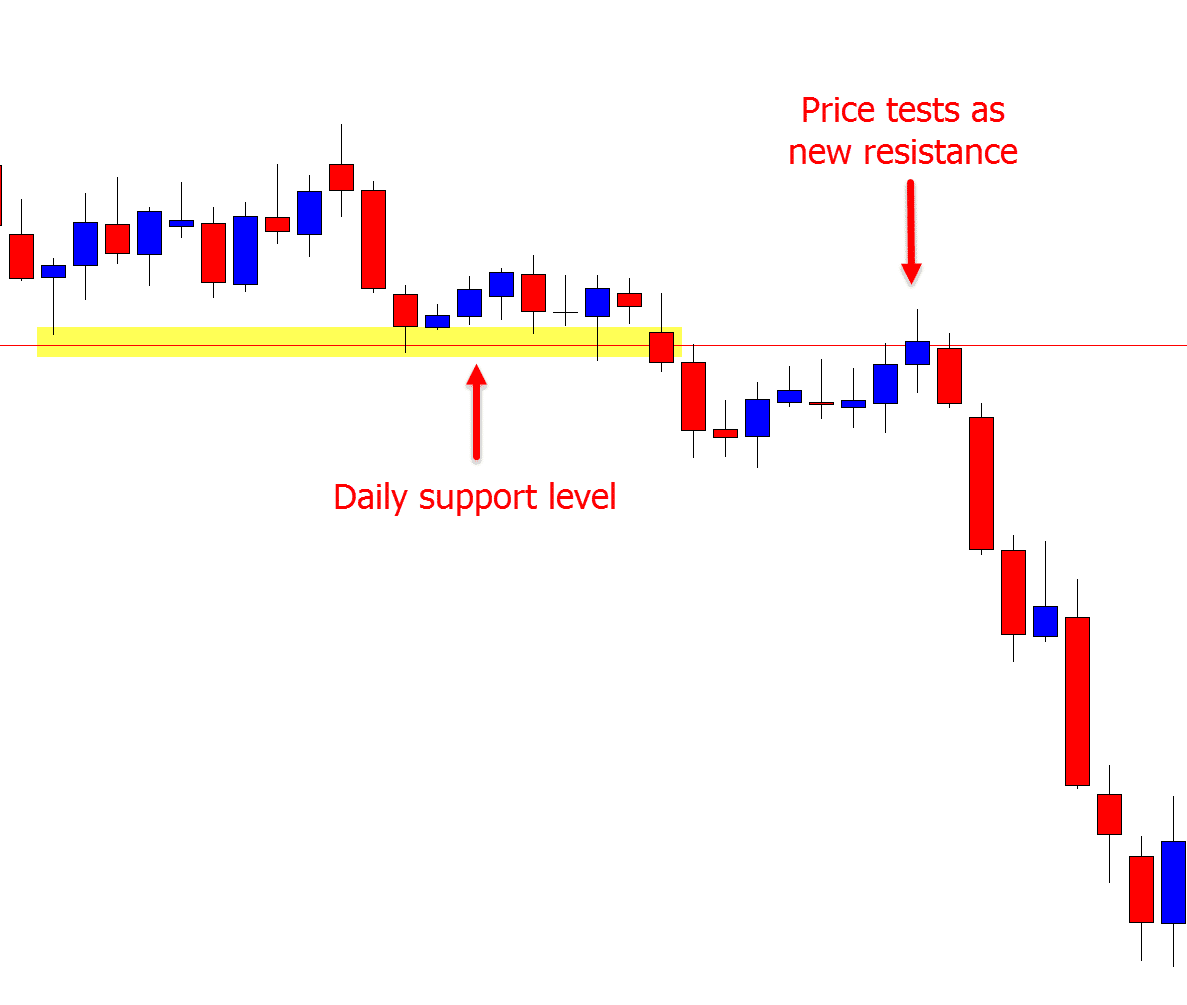
Below I have attached an example showing how we would first mark our major level on the daily chart. Once we see price beginning to move higher and back into the old support and new resistance we could watch for potential bearish price action trades on smaller time frames.
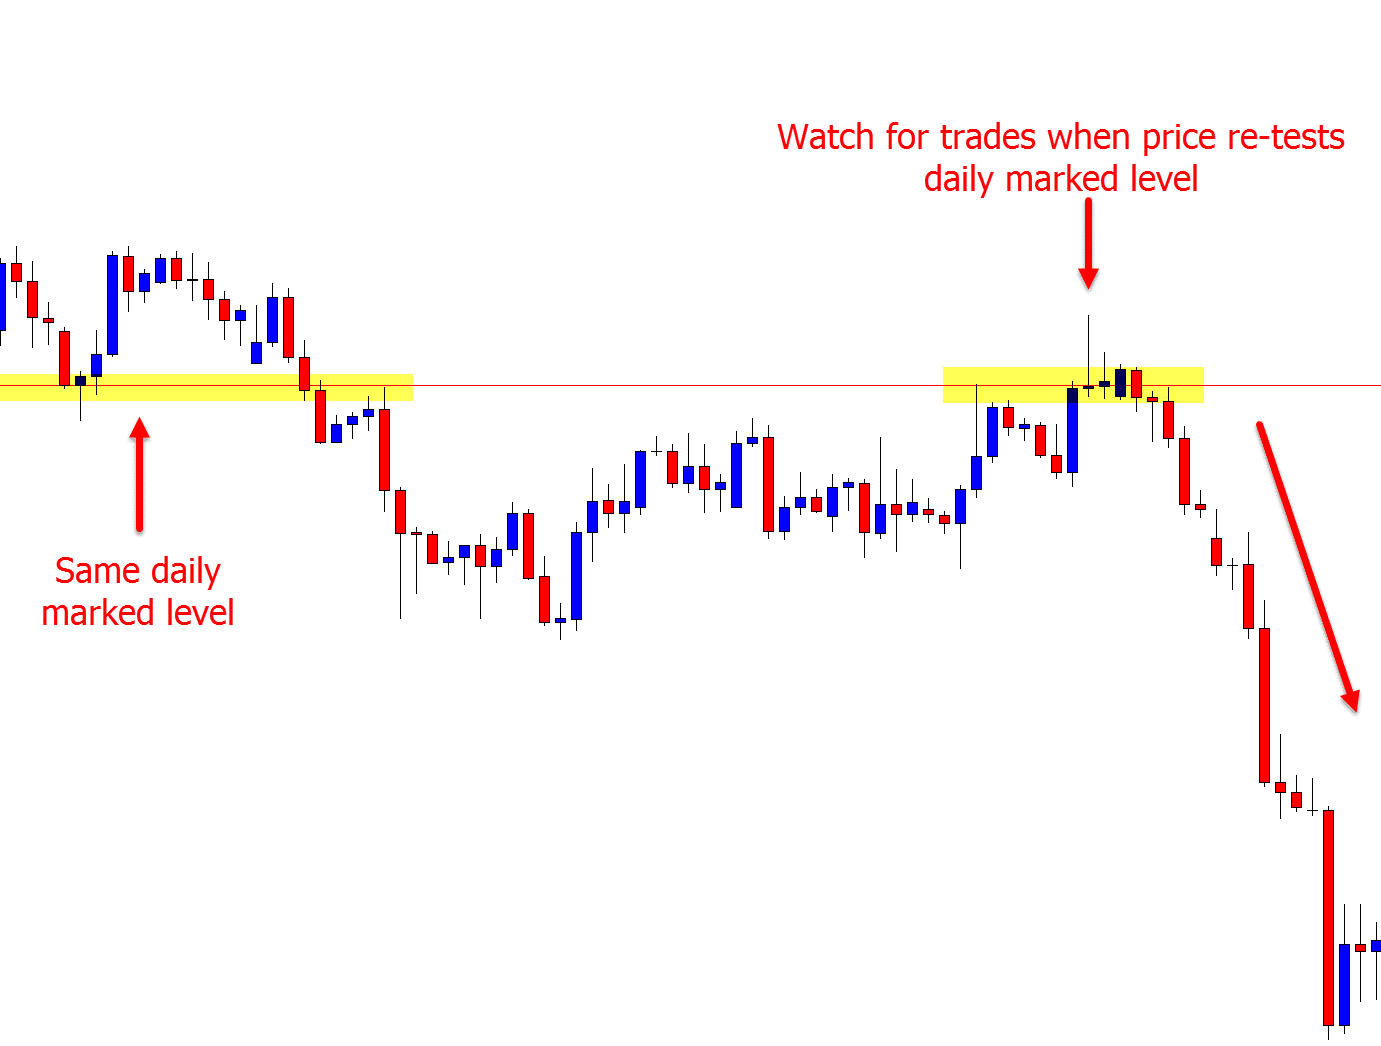
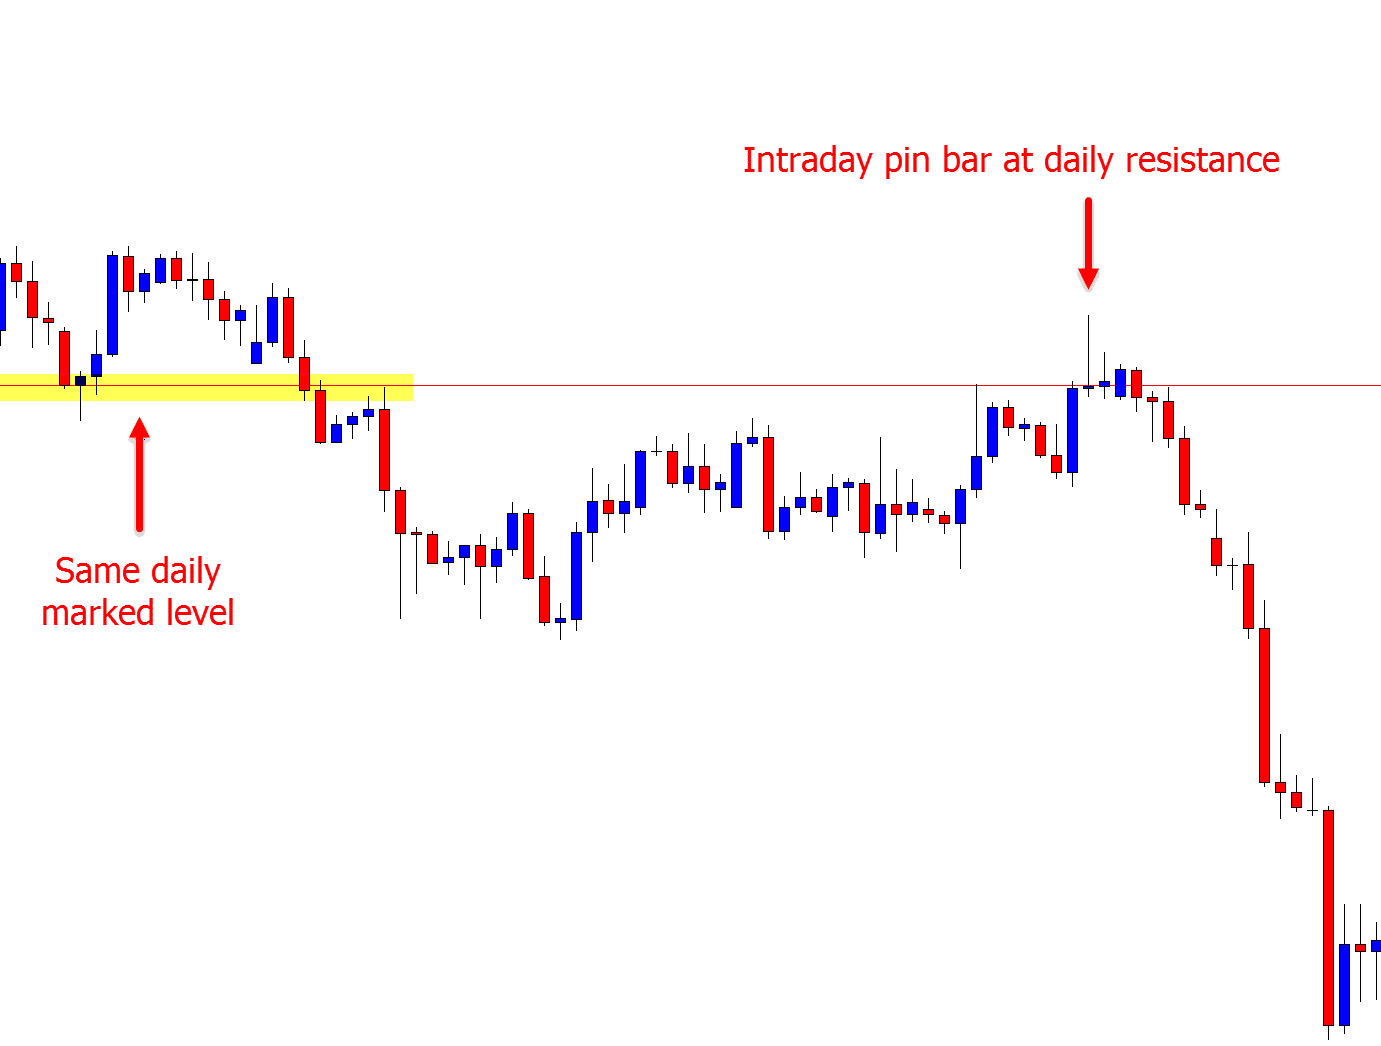
The chart below shows price moving higher on the intraday time frame and into the same daily resistance. This is where we could watch for potential bearish price action trades.
Read the lesson on how to mark your major support and resistance levels on daily charts
Intraday Trend Trading
When looking to identify and then trade with a trend on the daily charts we can be waiting weeks to months for a trend to form.
On the smaller intraday time frames short-term trends are forming every day.
Looking to trade with the momentum and recent trend is often very favorable and this can be even more so on the smaller time frames when looking for smaller pip profits.
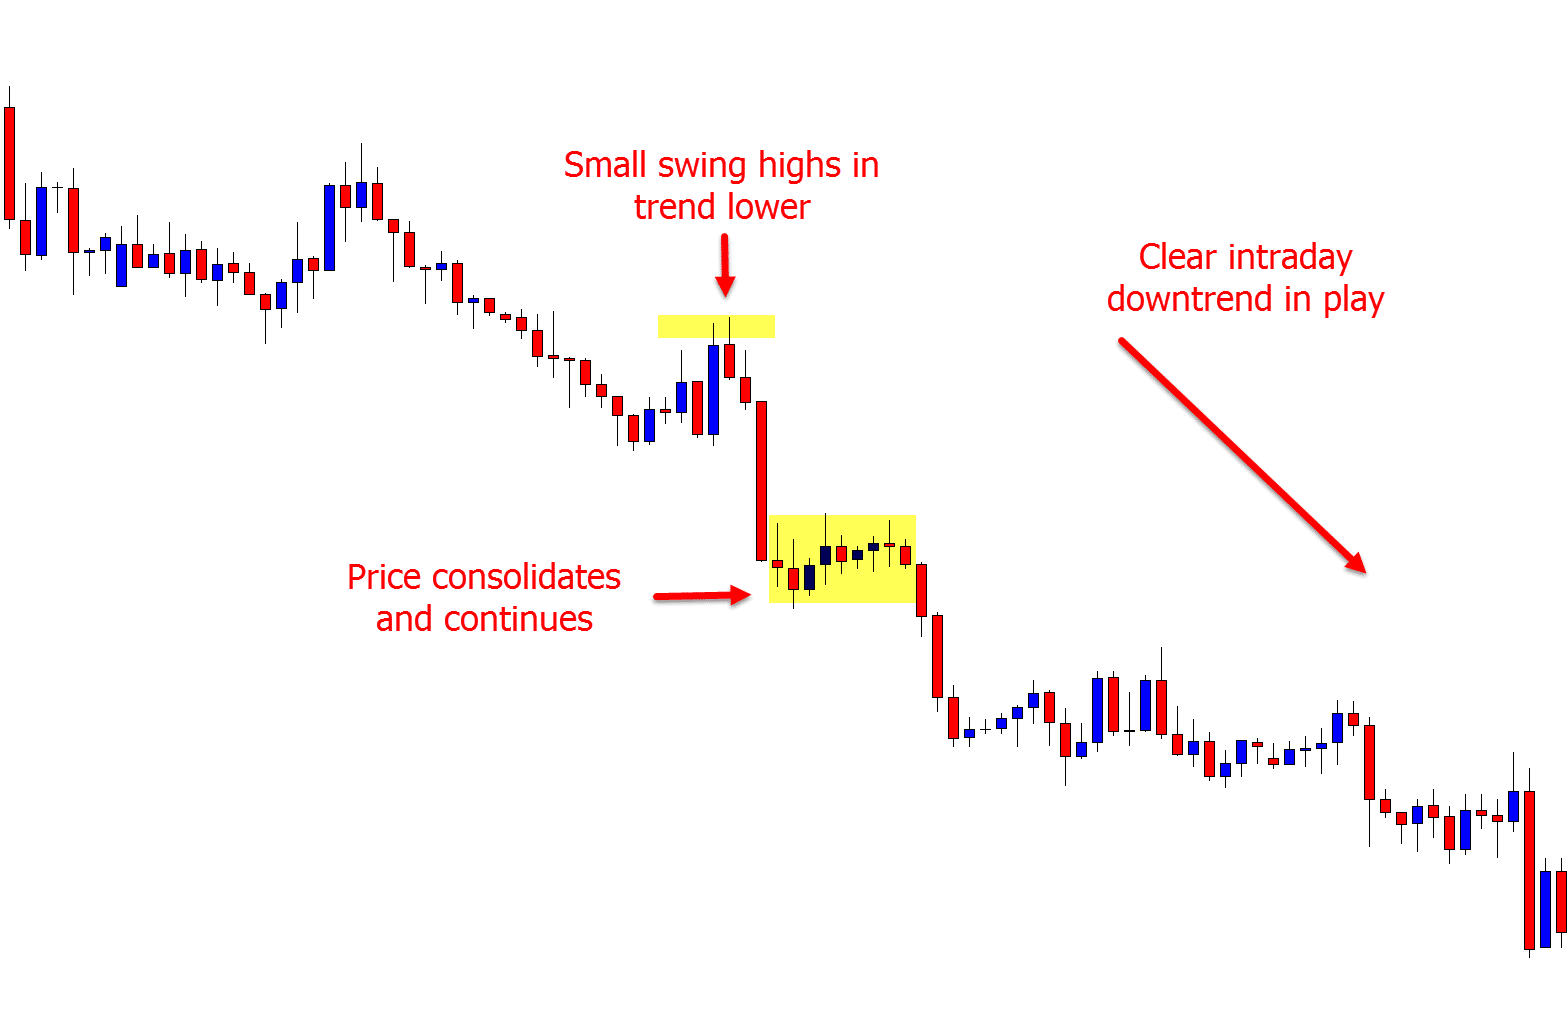
The two best strategies to get into trends on intraday charts both involve reading and using the price action clues. The first involves looking for price to make quick pullbacks or rotations into value areas. This is like looking for the next wave to occur so you can ride it with the trend.
The second strategy is watching for when price pauses within the trend, consolidates and moves sideways. This will often be in a box shape or pattern. We can then look to play the breakout of the box in the trend direction.
Read more: How to trend trade price action
Using Key Price Flip Levels to Intraday Trade
Whilst these can be a little trickier to spot until you have more experience, they can also offer high probability trading setups when done correctly.
When looking to trade intraday price flips you are looking to trade support and resistance levels that have ‘flipped’. In other words; a resistance level that has now flipped and holds as a new support. Or, a support level that has flipped and is now holding as a new resistance.
The best way to show this is with an example. Below is a chart showing price making a large move lower and through what was the daily chart support level.
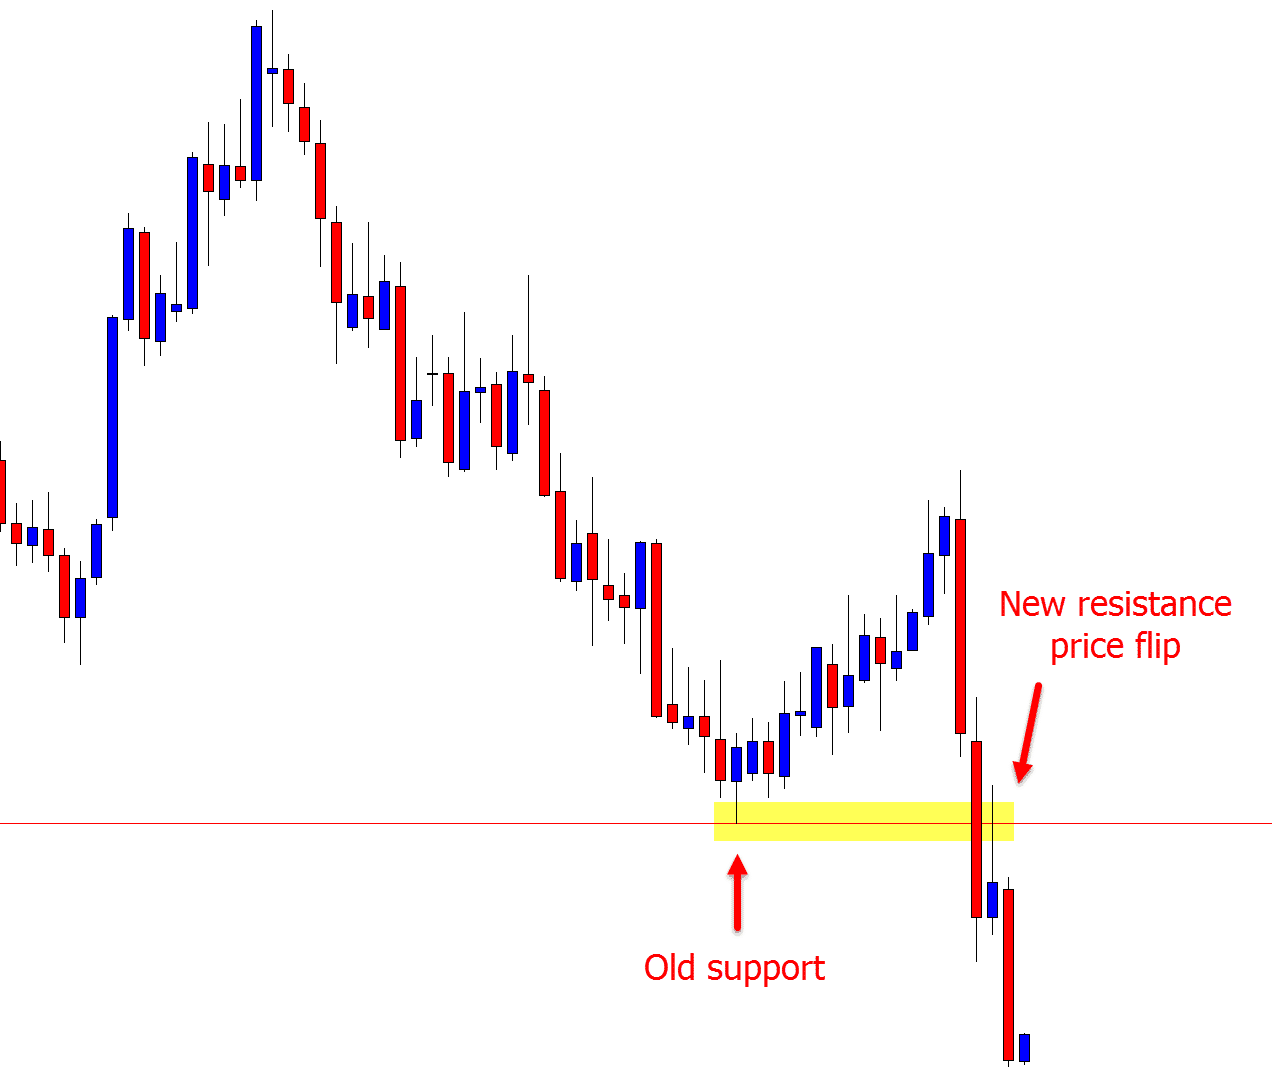
When we see this level break we could move to smaller intraday time frames to see if price rotates back higher and the old support ‘flips’ and holds as a new resistance.
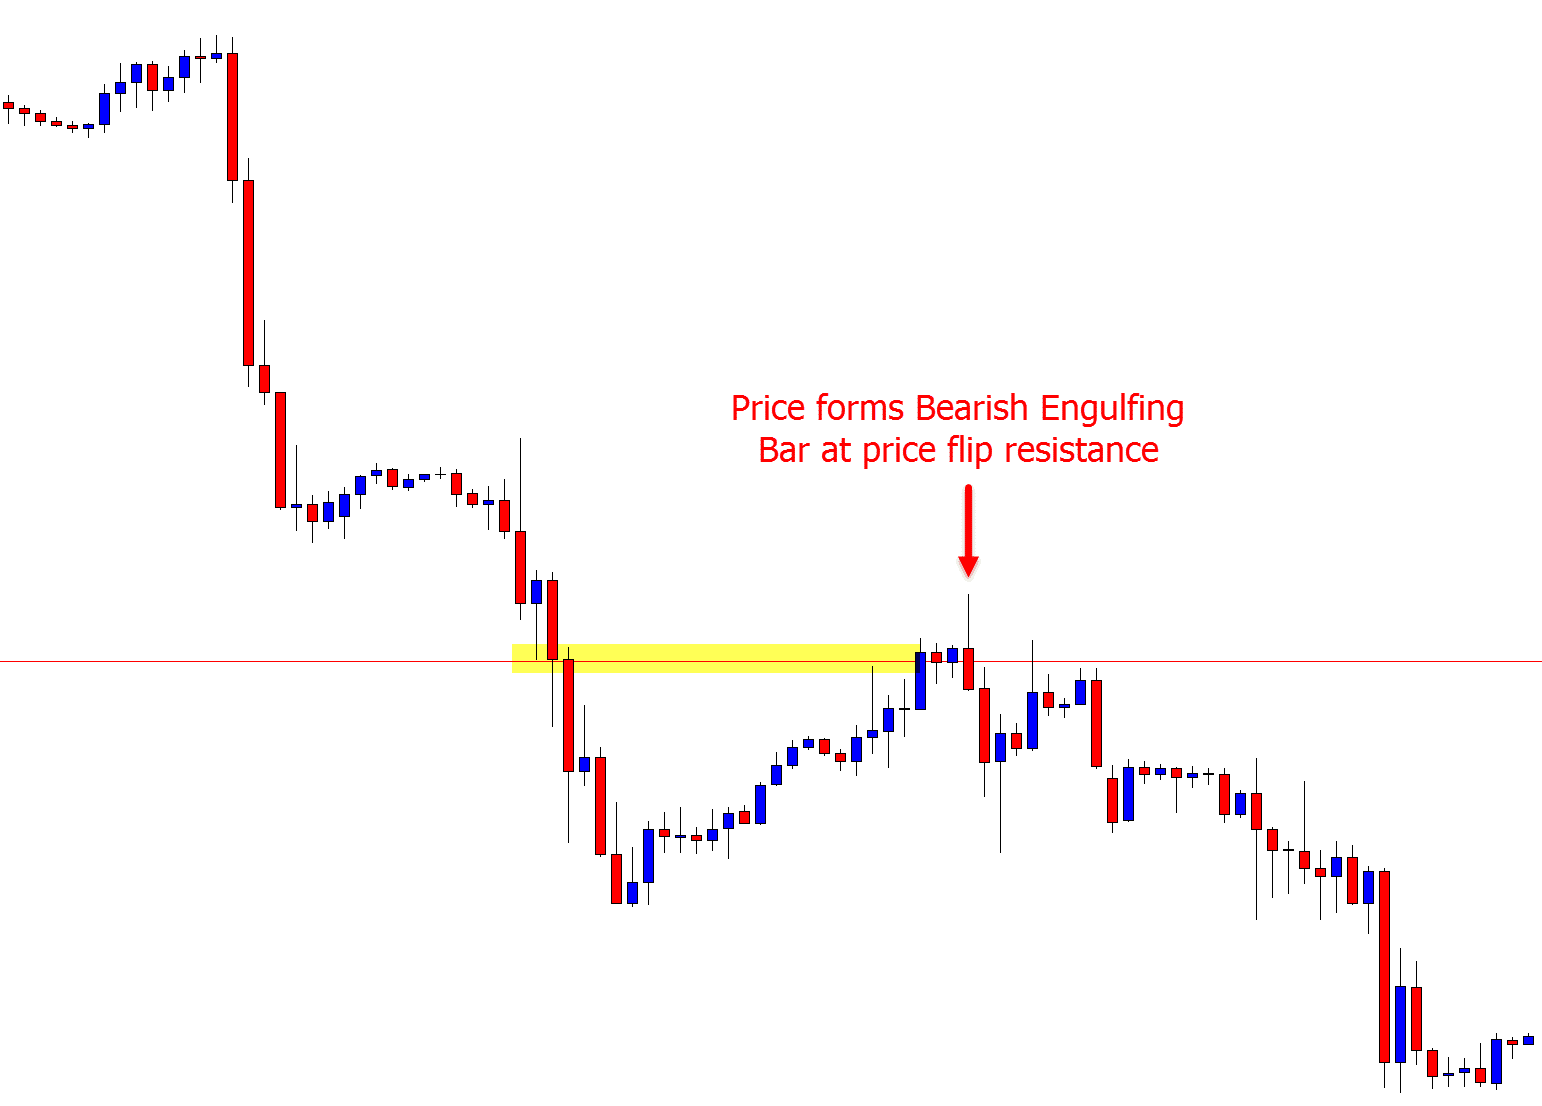
The chart below shows this same daily chart level, but on the 1 hour chart. Price has popped higher to test the new resistance, formed a bearish engulfing bar and sold off lower. We discussed this setup recently in our Price Action Trade Ideas.
Read more: How to trade price flip support and resistance levels
Intraday Range Trading
Price on intraday charts will often move into sideways ranges.
There are two ways you can play them. The first is to look for a breakout and the second is a straight range play. This involves looking to get short from the range resistance and long from the range support.
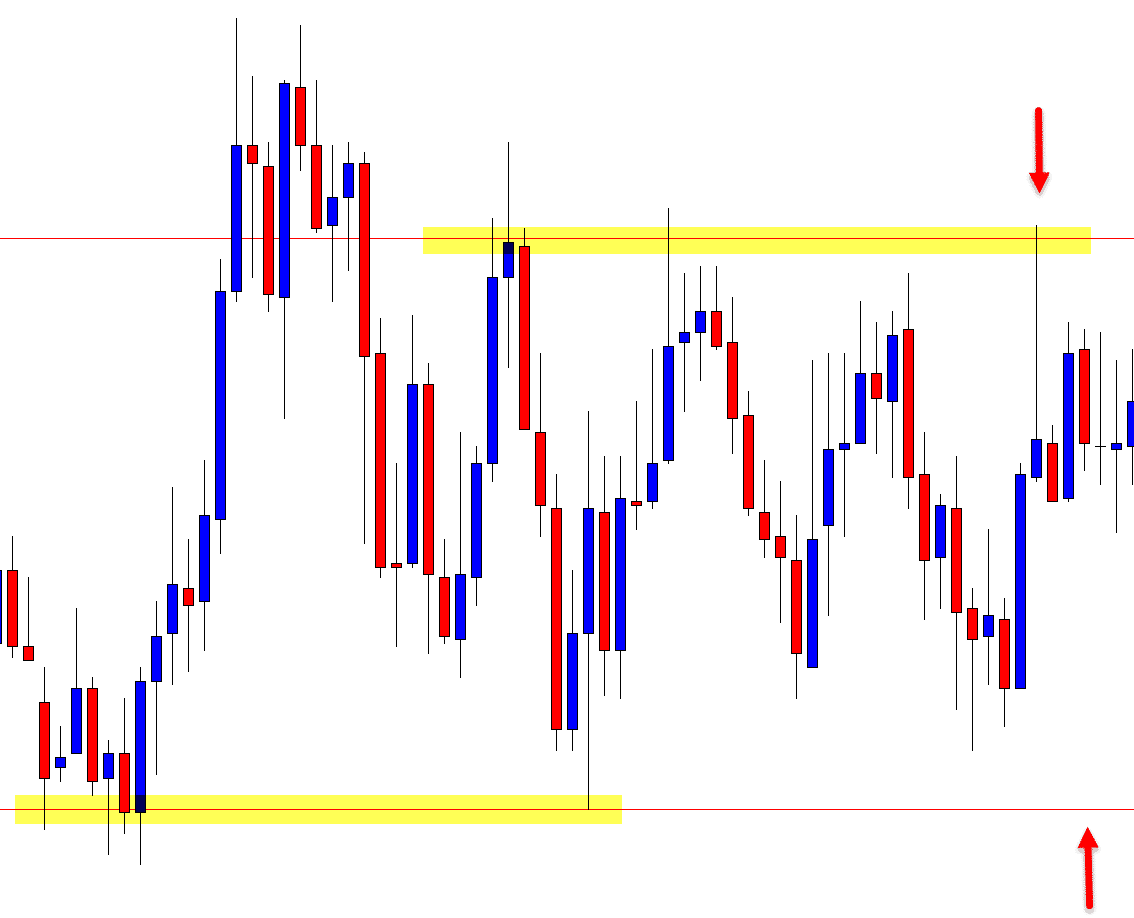
One thing to be mindful and cautious of when trading intraday ranges is that you want the range to have a clear high and low and that there is enough space in between for a decent risk reward trade.
If you are entering a range and the range is super enclosed with a tight space between the support and resistance it will increase the risk for chop. You will run a high risk of being whipsawed out of the range and making a loss even if you pick the direction correctly on your trade.
Read more: How to trade range bound markets
Intraday Breakout Trading
Looking to trade intraday breakouts is riskier and is a more advanced strategy. Because it carries more risk it can also lead to more reward. It can also lead to some explosive moves very quickly.
If looking to trade intraday breakouts you need to have all of your trading basics down including how you place and manage your stop loss, how you take profit and how you manage your trades.
The chart below is a daily chart showing how price had tested the major resistance level twice in recent times and was looking to make a potential breakout higher.
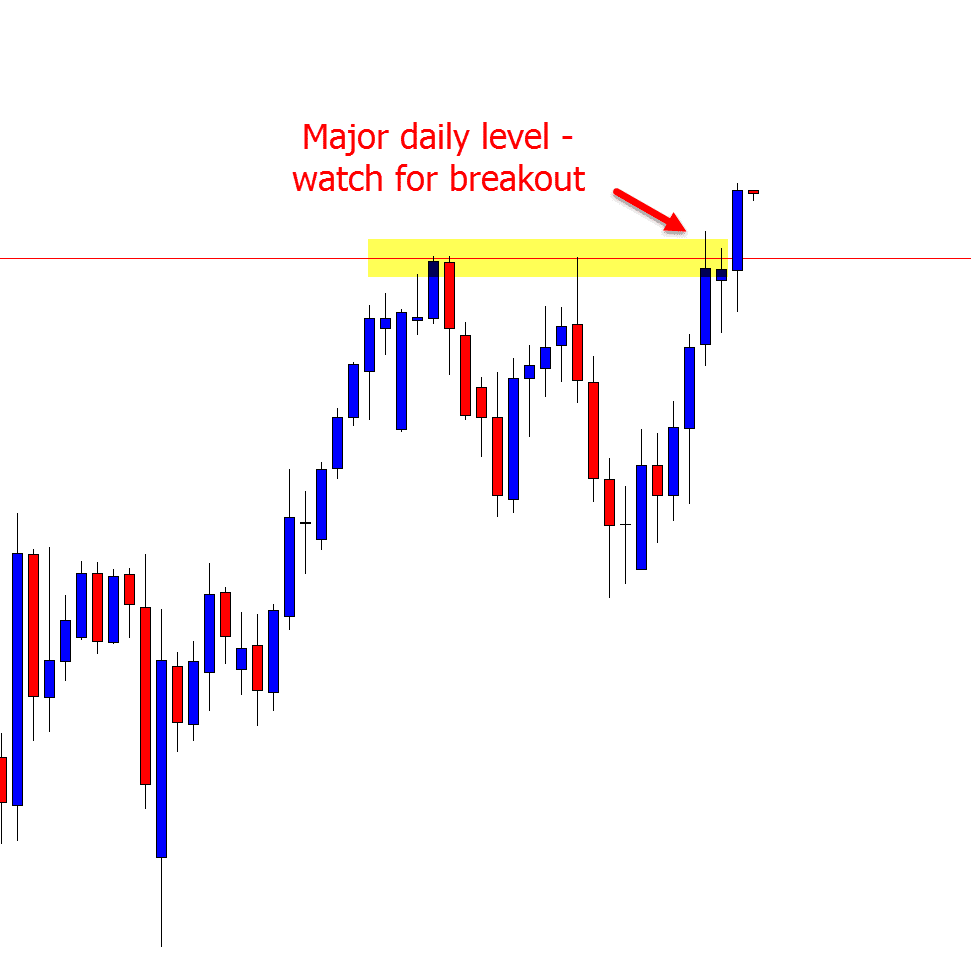
When breakout traders see this occurring they could move to their smaller intraday time frames to see if they can find breakout trades.
The chart below is the 4 hour chart showing price making an explosive breakout higher through the resistance.
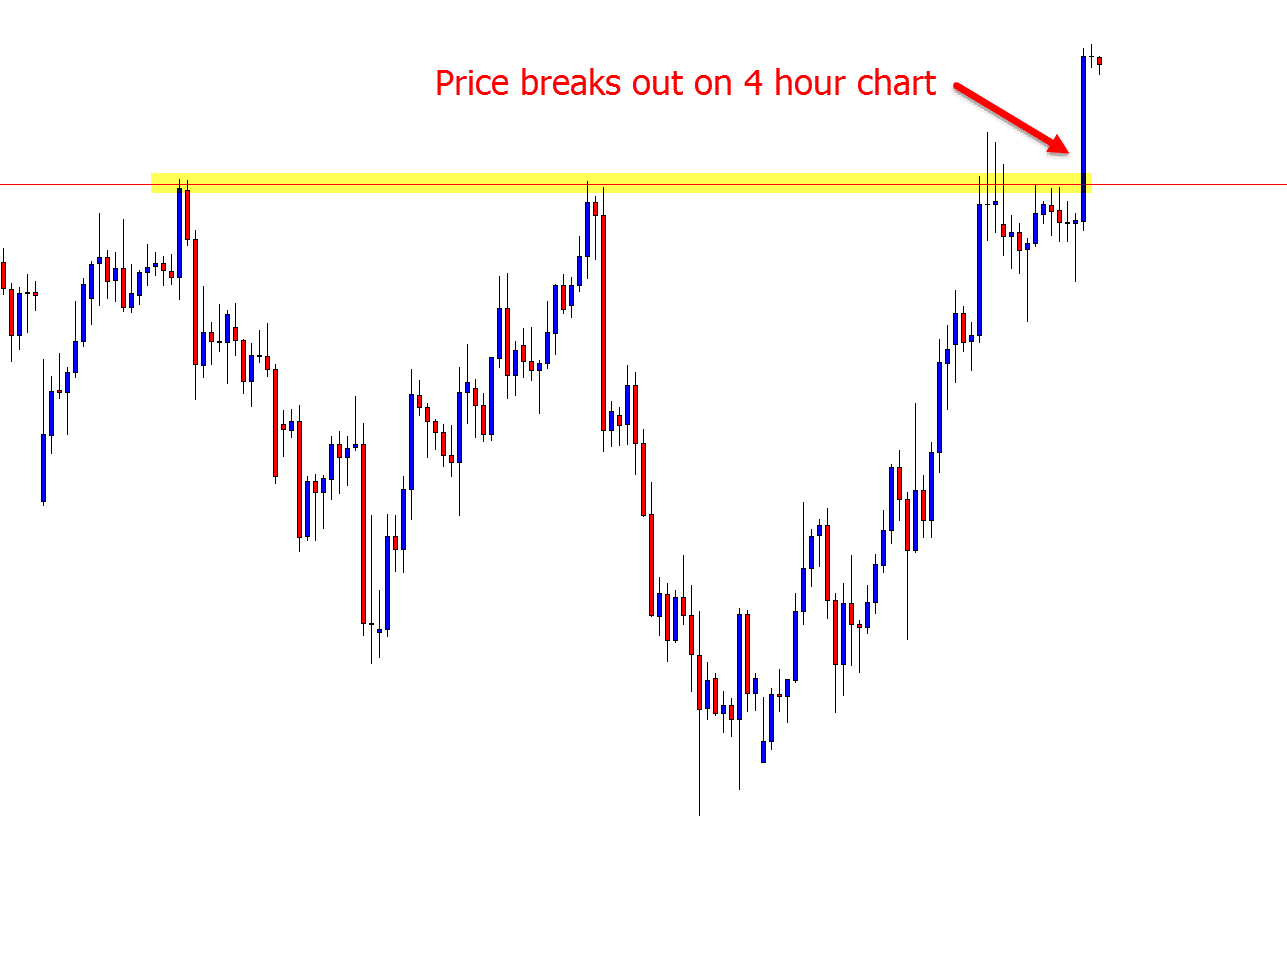
Whilst you can look to use the price action clues and make straight breakout trades, you can also look to make breakout and re-test trades when price breaks out and re-tests the old price flip level.
Read more: How to trade intraday breakouts
Combining With Trigger Signals
All of the strategies discussed so far can be used in combination with high probability price action trigger signals such as the pin bar or engulfing bar.
An example of this could be to use a trigger signal to find a range trade or enter a trend trade using a high probability trigger signal.
The example below shows how a trigger signal could be used with a price flip level. The first chart shows price breaking higher and through the daily chart resistance.
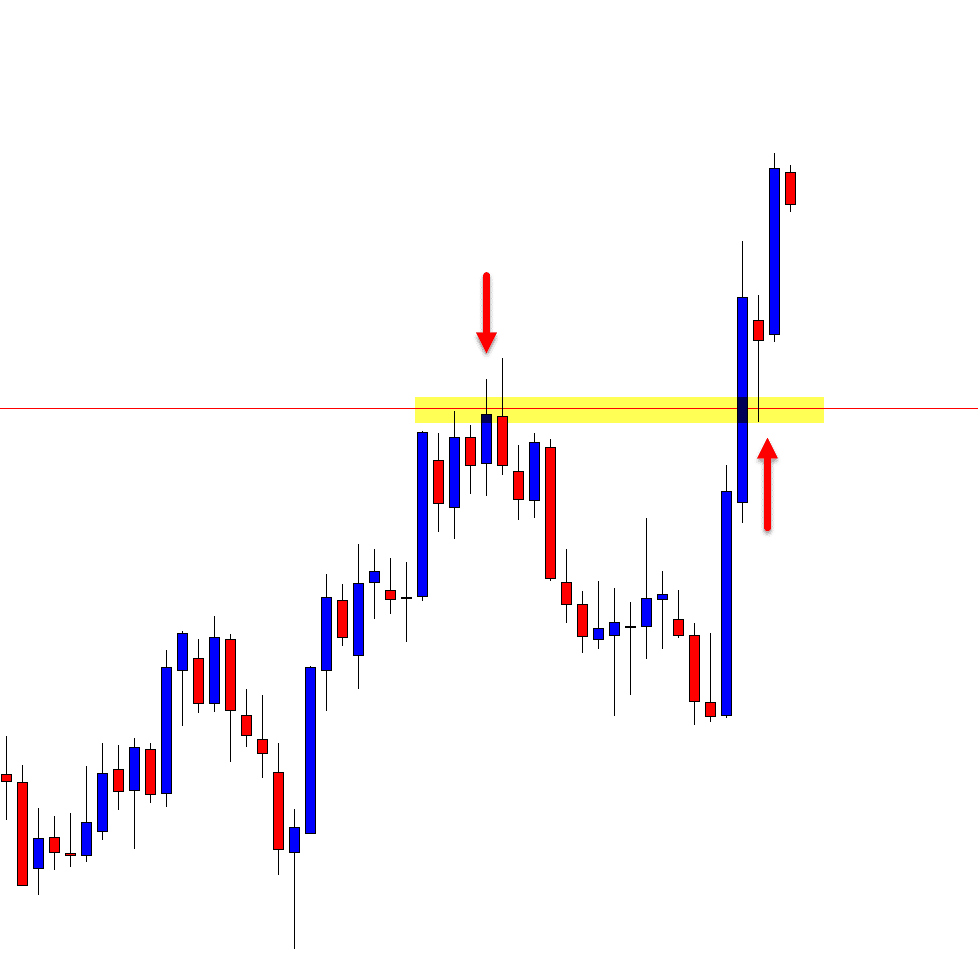
The second chart is the intraday 2 hour chart. This shows price rotating back lower into the same old resistance that now holds as a new price flip support level. Price fires off a high probability pin bar and continues on higher.
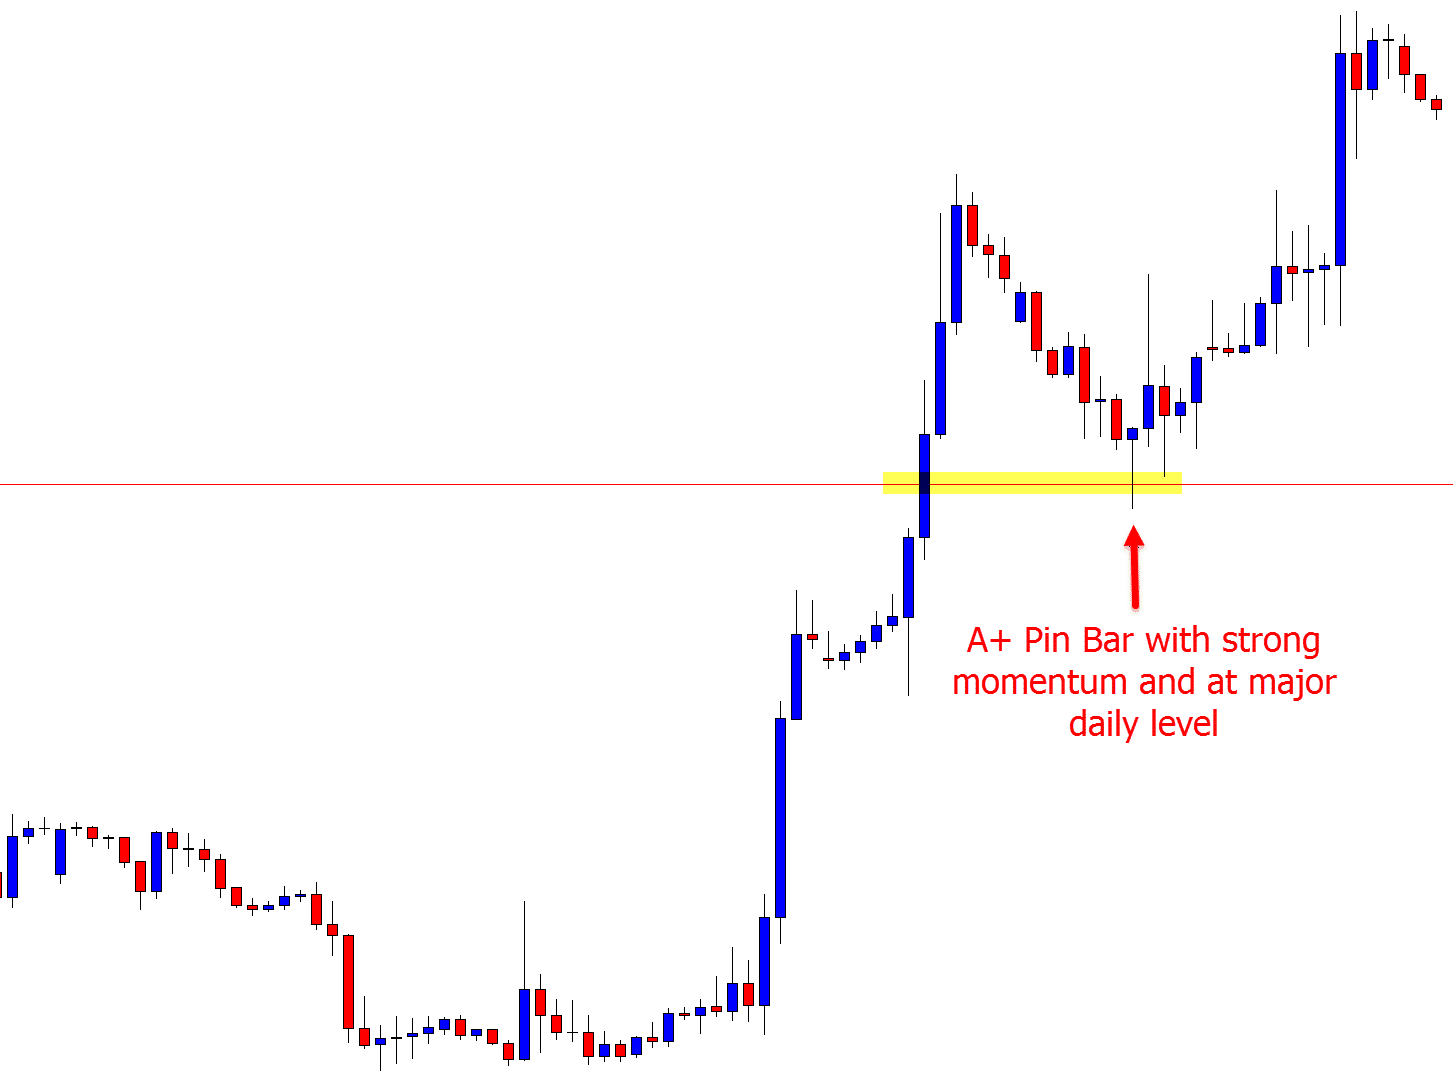
NOTE: You can create 2 hour charts (and any other time frame) inside your MT4 with the MT4 Free Time Change Indicator
Lastly
Some of these strategies discussed are easier to identify and trade than others and some will take a lot more practice to get down.
You don’t need to know or use them all. Find what suits you best, what fits your trading style and work on those making sure you always test and work on new strategies in your practice demo account before ever risking real money.
Please leave questions or comments in the comments section below;


I like this article very much. I’d like to also thanks Johnathon & he lives long time in the world to gives us better analysis for forex market.
Thanks
Thanks for this great write-up, i learnt so much about this strategies;
I have a major problem that i always encounter which is i always enter a trade too early and also let my loss run into a big one.
Any idea on how to solve this issue.
Hi Sunny,
this is common and involves mindset more than strategy. Give the following two lessons a look and let us know if any questions;
https://www.forexschoolonline.com//a-study-on-thinking-feeling-how-professional-traders-react-to-emotions/
https://www.forexschoolonline.com//mark-douglas-5-trading-truths/
Johnathon