Gold v USD
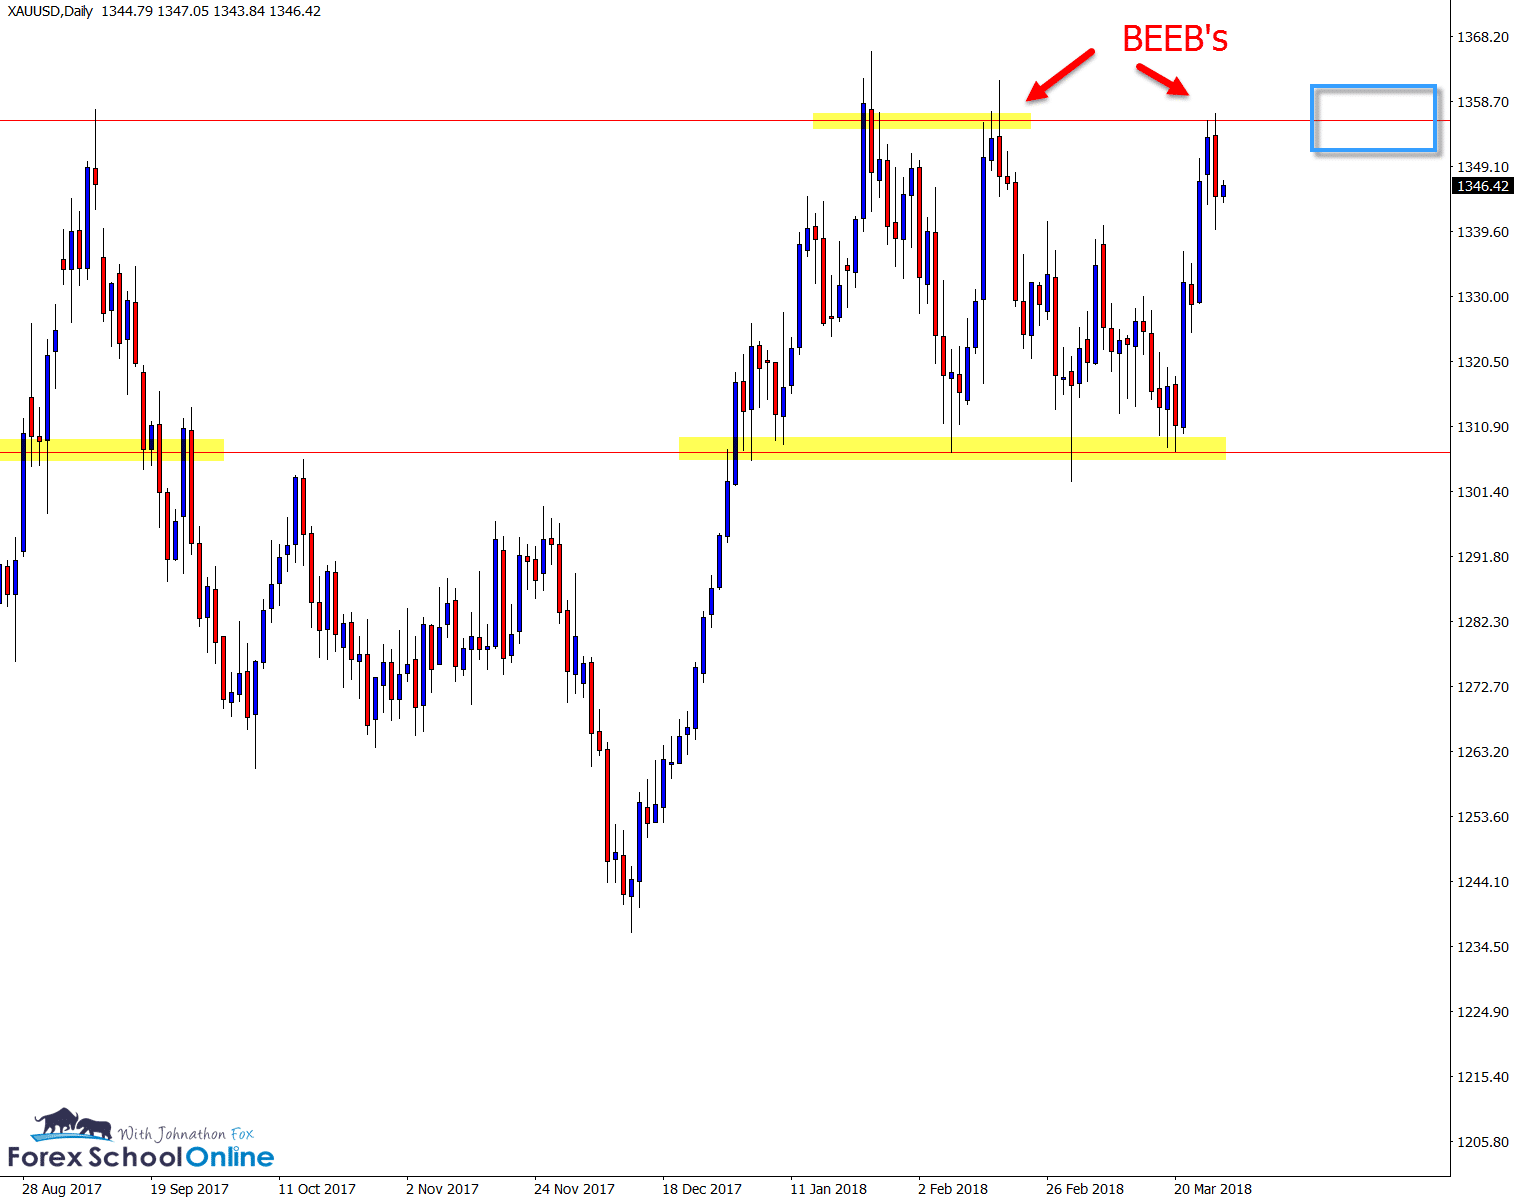
Price action on the daily chart of the Gold v USD is stuck in a sideways range and consolidation box.
Like the chart shows below; price has a clear high and low to the range and has fired off some solid price action triggers in recent times at both the support and resistance.
Down at the low we can see price has made multiple attempts at breaking support and also fired off a large false break pin bar. At the major resistance we have two Bearish Engulfing Bars = BEEB’s rejecting the level and higher prices.
Any break of these levels could be explosive and could open the door to a lot of potential trade opportunities.
Daily Gold Chart

SEKJPY Charts
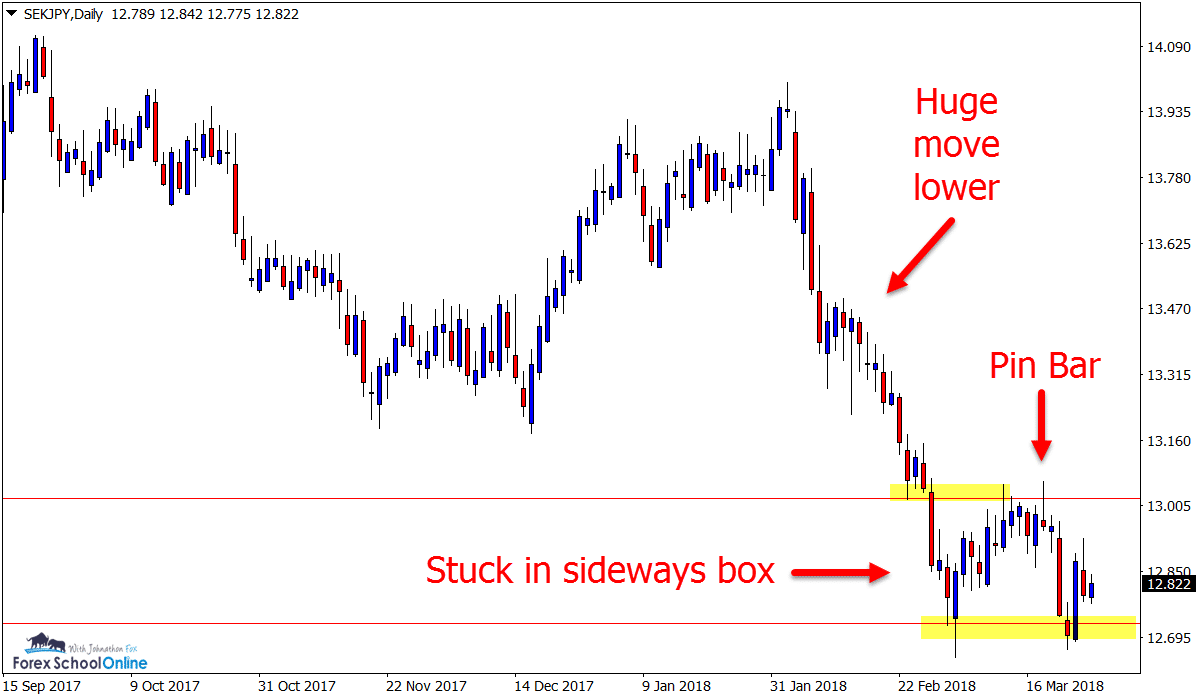
Similar to the Gold price action, the SEKJPY is also stuck in a consolidation box.
Price on the daily chart had been making a solid move lower before it snapped into support and bounced higher. Since then price has been bouncing between this box.
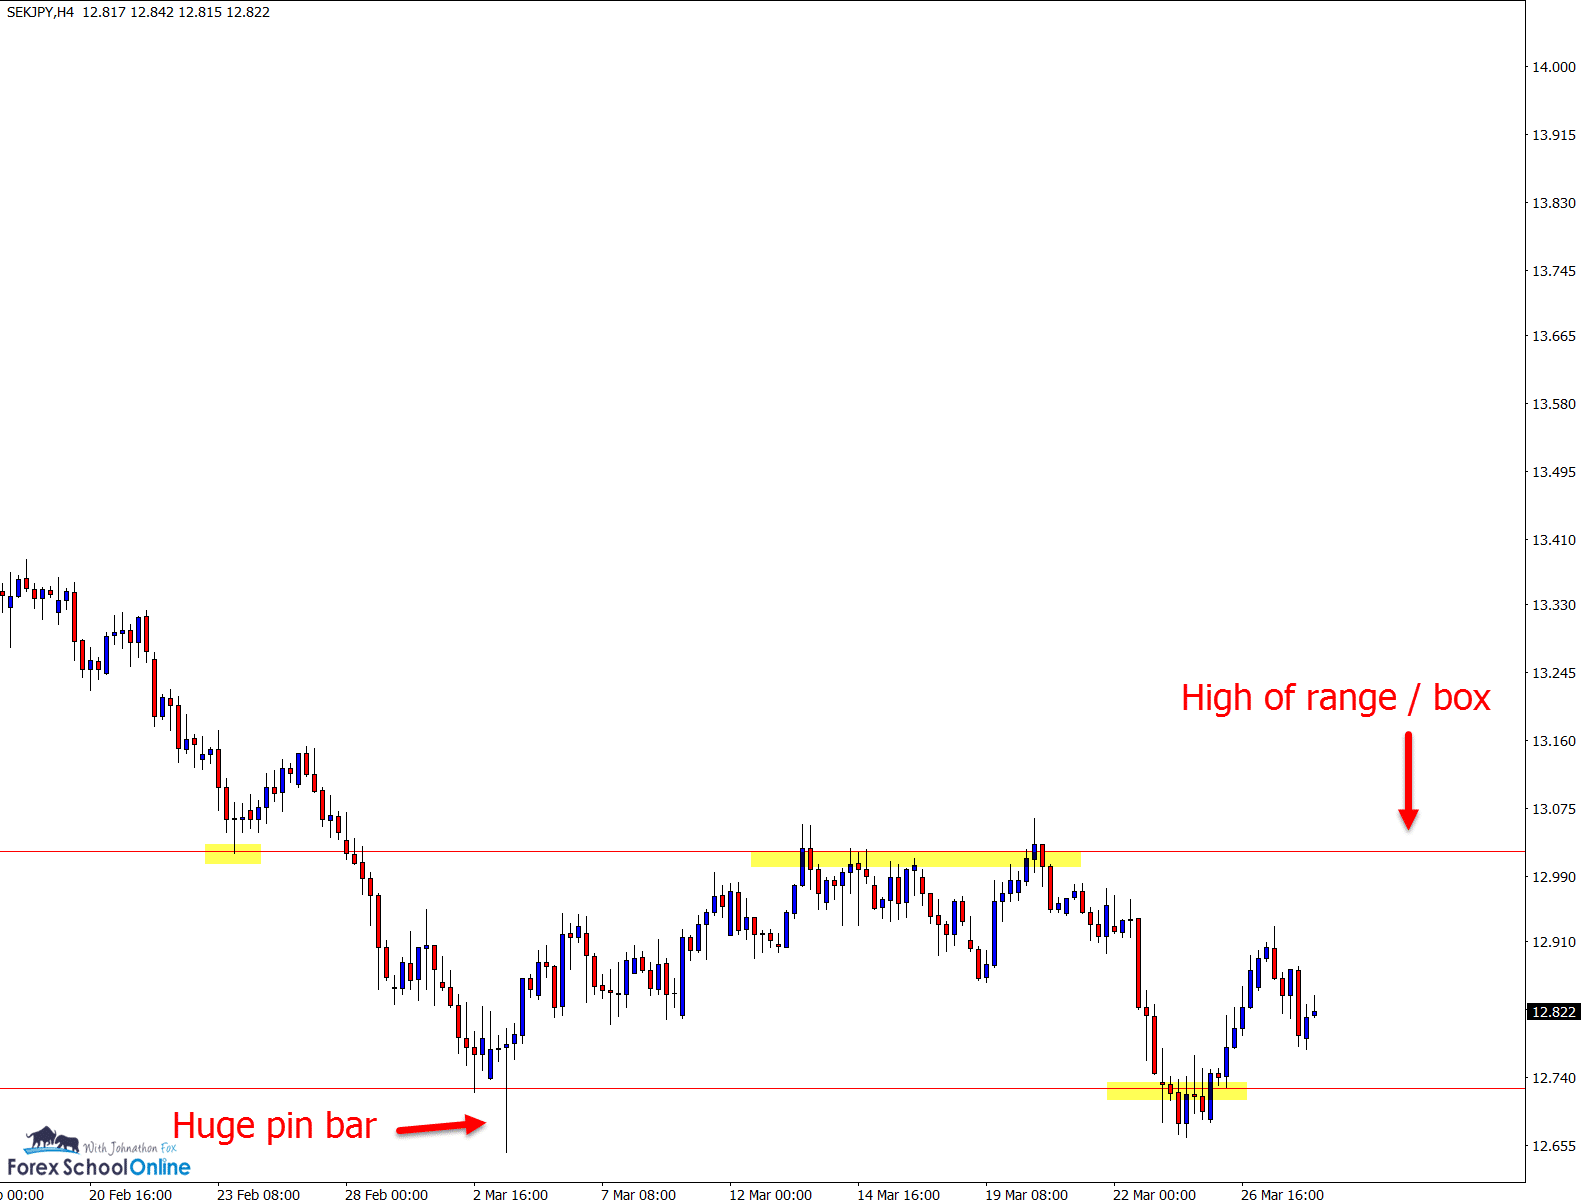
As the intraday 4 hour chart shows below; the levels are clear for the high and low. For price to start a serious move back higher, the major daily resistance and box consolidation high would need to be taken out.
Just like the Gold market above; whilst the box high and low are in play as key levels; any breaks could open up smaller time frame trades for aggressive traders.
Read more about how the market makes it’s moves in the lesson;
Price Action Continuation and Consolidation Rules
SEKJPY Daily Charts

SEKJPY 4 Hour Chart


Jonathan
Can you please recommend the best broker to user for trading many of the brokers are scammers and is hard to know which broker to use when trading
I would like to trade but my problem is the brokers
Regards
Gladys
Hi Gladys,
we discuss what to look for in brokers and charts in the lesson here; https://www.forexschoolonline.com//recommended-forex-broker-charts-price-action-traders/
Any questions let us know.
Safe trading.