The price action in the GBP/USD market yesterday continued its impressive performance, which started last Friday. However, today’s trading has started with traders going short on the pair. This seems to reveal that price upside momentum may be nearly exhausted.
Major Price Levels:
Top Levels: 1.2188, 1.2200, 1.2230
Floor Levels: 1.2165, 1.2120, 1.2100

GBP/USD Maintains Upside Signs on the Daily Market
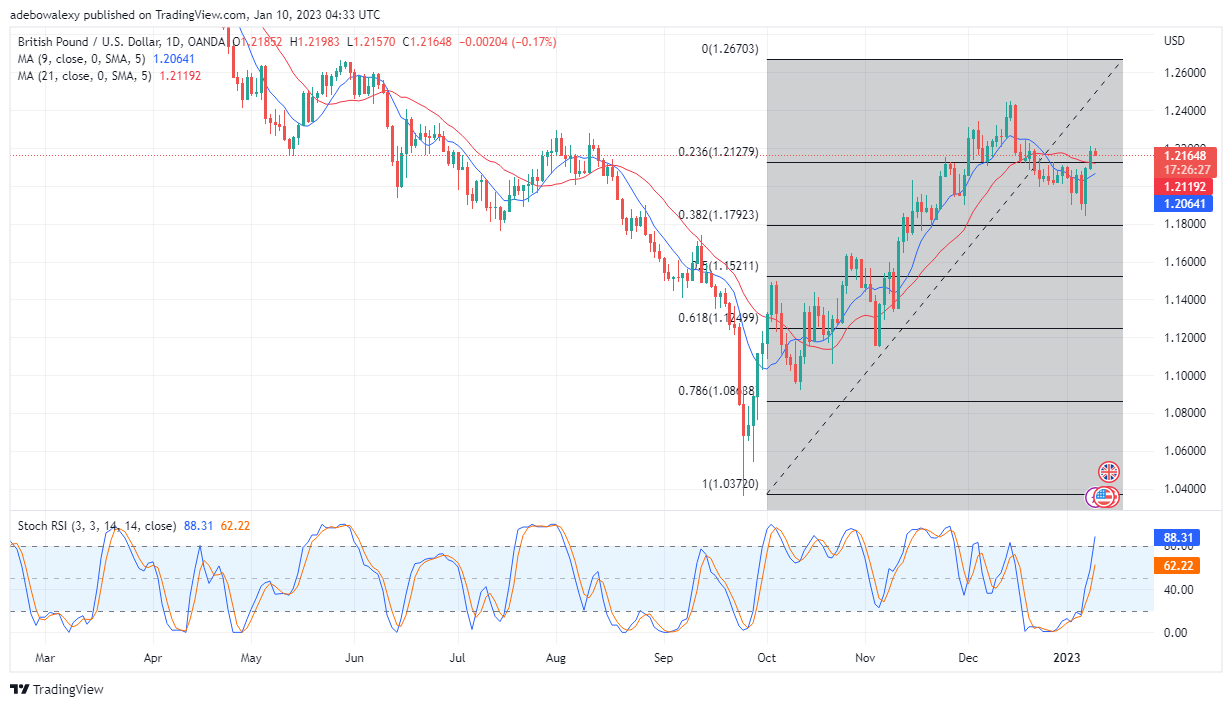
Price activities on the GBP/USD 24-hour market appear to be keeping up with the signs of a possible continued upside movement. However, through the price candle for this session, we can see that upside forces are losing strength. A bearish price candle has formed for this ongoing session and has plunged prices to 1.2165. Yet, the current price of the pair stays above the 9- and 21-day MA. Also, the lines of the RSI keep rising into the overbought zone, indicating that the upside price movement is still on. Nonetheless, traders are advised to carry out a closer examination of price movements before making bullish predictions.

GBP/USD Price Continues to Trickle Down Towards the 9-day Moving Average Curve
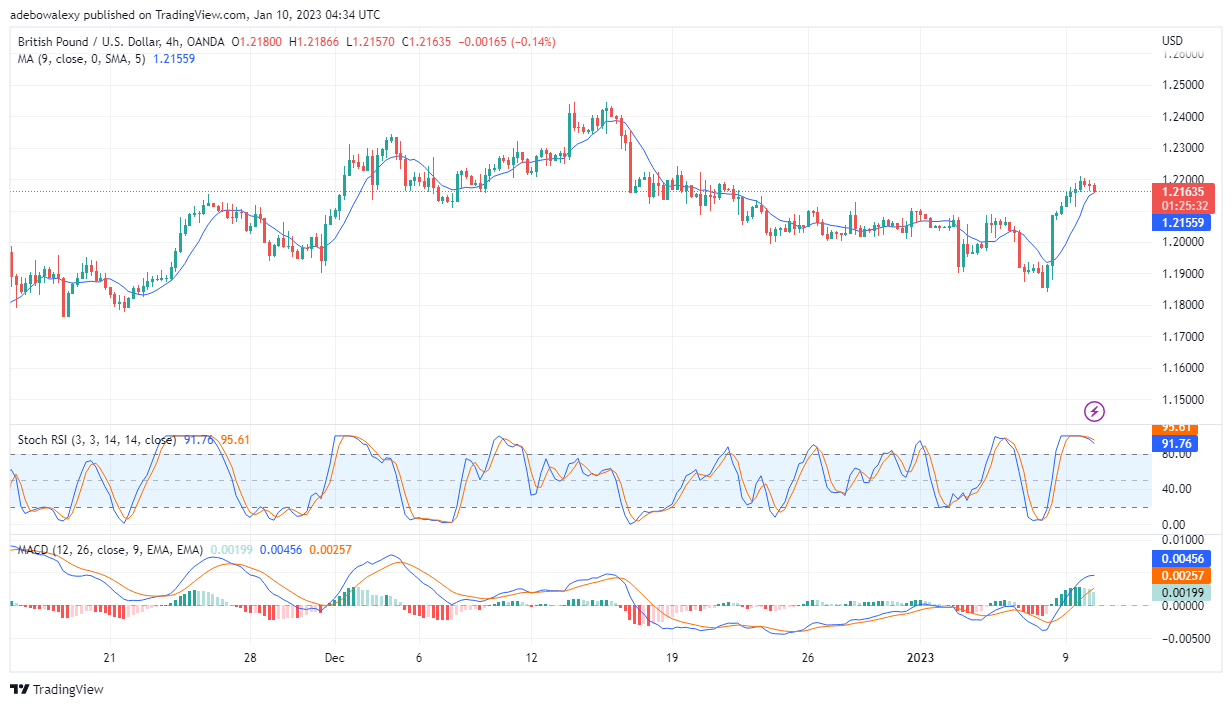
Both price action and technical indicators are showing more vivid signs of price reduction in the GBP/USD 4-hour market. Although there is low volatility, bearish price candles have consistently appeared over the past two trading sessions. The last price candle here has touched the 9-day MA line. Meanwhile, the Stochastic RSI has delivered a bearish crossover in the overbought region and is now smoothly making its way downward. Also, the lines of the MACD indicator are now indicating that the upside strength is weakening. This could be observed via the histogram bars of this indicator, as they are now turning pale green. Consequently, traders can expect prices to fall to around 1.2150 as trading activities continue.
Do you want to take your trading to the next level? Join the best platform for that here.


Leave a Reply