GBP/USD Price Prediction – July 4
The GBP/USD market price trades beneath the 1.2300 resistance line. In recent-past operations, the currency pair traded in a range-bound manner that lasted for a few days. Price is trading around 1.2159 at a minimal positive percentage rate of 0.55.
GBP/USD Market
Key Levels:
Resistance levels: 1.2300, 1.2400, 1.2500
Support levels: 1.2000, 1.1900, 1.1800
GBP/USD – Daily Chart
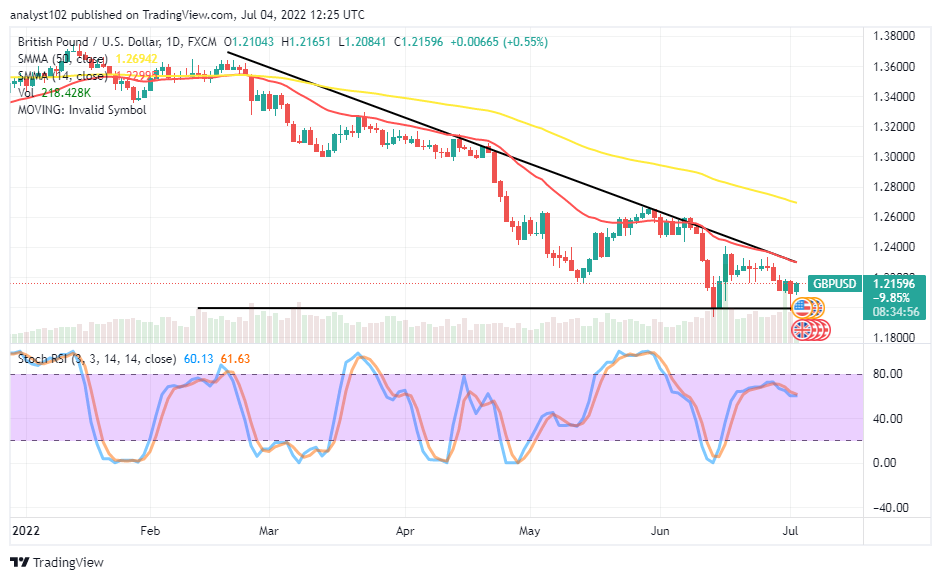
The GBP/USD daily chart shows the currency pair price trades beneath the 1.2300 resistance level. The bearish trend line drew southward to conjoin with the 14-day SMA trading indicator underneath the 50-day SMA indicator. The Stochastic Oscillators have crossed southbound from below the range of 80. And they are somewhat trying to close the lines around the 60 range. A bullish candlestick is in the making to signify that the market may be experiencing an upward motion soon. Will the GBP/USD market hold long below the 1.2300 resistance level?
There is the possibility of the GBP/USD market operations holding long below the 1.2300 resistance level as the currency price trades beneath it currently. The horizontal line drawn at the 1.2000 support level is to let long-position takers envisage an ideal area for getting a rebound that their entries can leverage.
On the downside of the technical analysis, the GBP/USD market sellers needed to be cautious of launching new selling orders as there has been a bullish candlestick showcasing a warning signal against it. It would technically augur well to wait for the price to touch a resistance around the 14-day SMA trend line to observe if a rejection plays out to back a shorting order afterward.
Summarily, the GBP/USD market tends to trade under depressions below the resistances of 1.2400 for the long term. GBP/USD 4-hour Chart
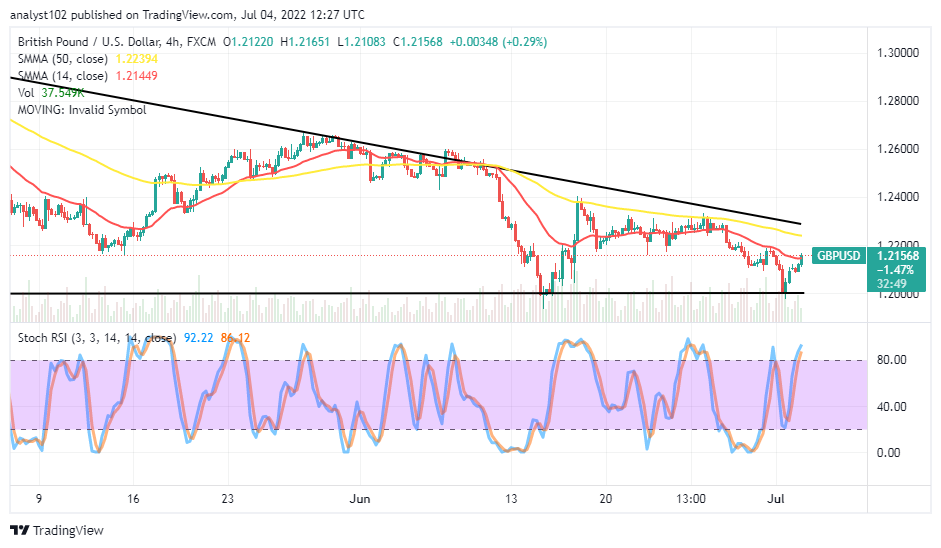
The GBP/USD medium-term chart reveals the currency pair price trades beneath the 1.2300 resistance level. Price has been relatively surging to breach past the smaller SMA. The 50-day SMA indicator showcases the next higher resistance point the market will attempt is 1.2240, as it placed above the 14-day SMA trading indicator. The Stochastic Oscillators have penetrated the overbought region to solidify that a buying force is ongoing. Traders may keep a sell pending order position the value line formerly mentioned with the setting of stop loss at an appropriate level for protection against any breakout.
Note: Forexschoolonline.com is not a financial advisor. Do your research before investing your funds in any financial asset or presented product or event. We are not responsible for your investing results.


Leave a Reply