GBP/USD Price Prediction – April 5
It happened lately that the GBP/USD market swung briefly above 1.3200 to eye a higher resistance line at 1.3300. Currently, the currency pair price declines past 1.3200 to trade between the high and the low of 1.3144 and 1.3106 at a minute positive percentage rate of 0.18.
GBP/USD Market
Key Levels:
Resistance levels: 1.3200, 1.3300, 1.3400
Support levels: 1.3000, 1.2900, 1.2800
GBP/USD – Daily Chart
The GBP/USD daily chart shows the currency pair price declines past 1.3200, having swung northward to high resistance. The market now keeps back within a descending triangular pattern, involving the value-line mentioned earlier, the 1.3100, and 1.3000 as the support baseline of the trading formational shape. The 14-day SMA is underneath the 50-day SMA. And they are above the current trading spot to signify that the market is under a selling force. The Stochastic Oscillators are swinging slantingly to the southbound against variant range lines closely over the range at 40.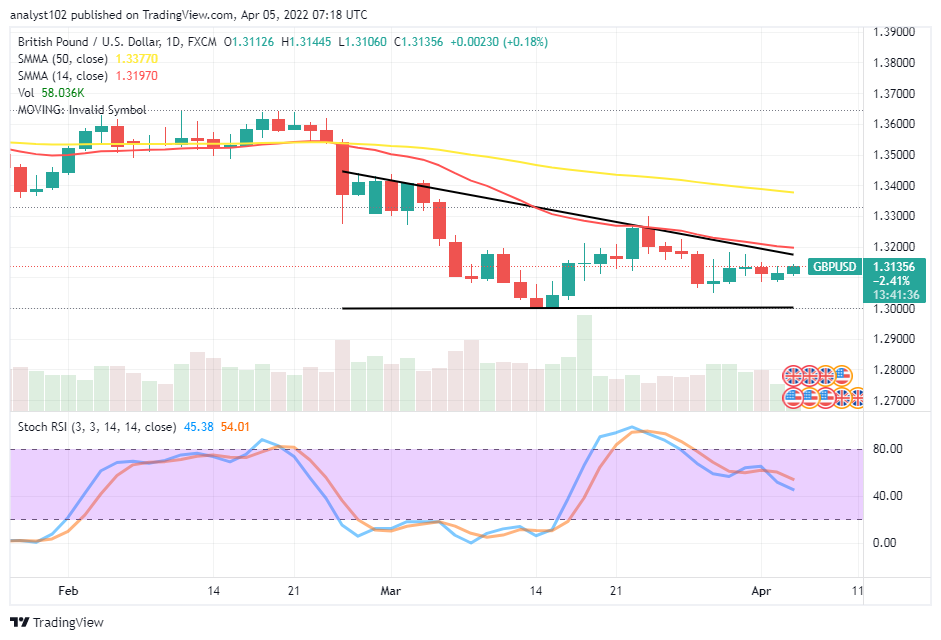 Can the GBP/USD market rebuild efforts to break back at the 1.3200 level to give room to ups afterward as the currency price declines past it?
It might take a while for the GBP/USD market to rebuild efforts to break out at the 1.3200 level as the currency pair price declines past it to keep within the descending triangular pattern. Being as it is, it appears the base currency instrument has not had a healthy moment to push at the purchasing power of the counter currency tool. But, 1.3000 remains the critical lower level bears may move before bulls can sustainably take control of the market operations.
On the downside of the technical analysis, the GBP/USD market bears are relatively in control of the currency business activities. However, a new joining of order to the downside may be too late as there can be a rebound in no time considering the length of closeness to the 1.3000 support baseline.
Summarily, as the GBP/USD market trend is still bearish, traders are to keep on looking for a reversal of an upward motion around the points of 1.3200 and 1.3300 to observe a decent sell entry. Bulls may have a bright chance of a re-launch of position around the 1.3000 support baseline afterward.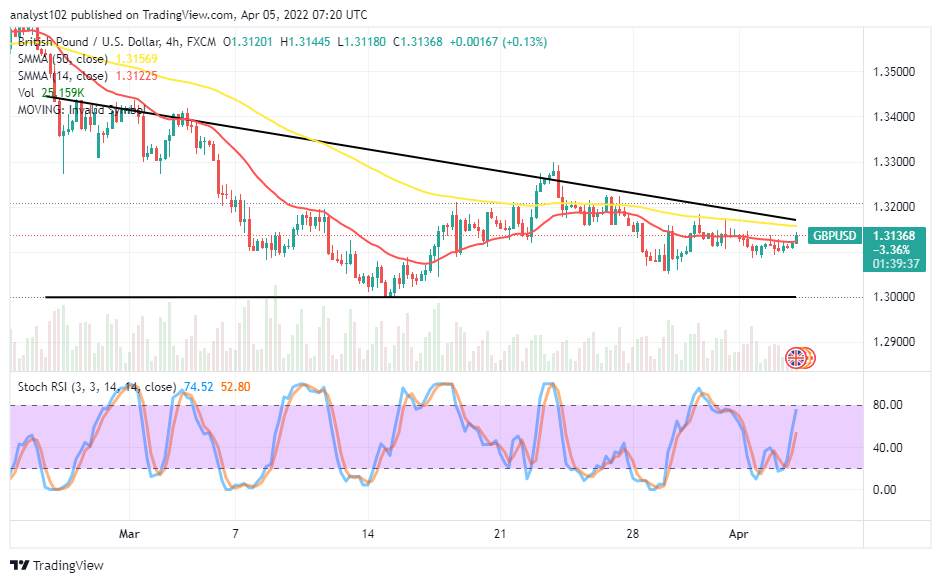 GBP/USD 4-hour Chart
The GBP/USD medium-term chart exhibits the currency pair price declines past 1.3200 after hitting resistance around 1.3300. The SMAs are between the descending triangular shape pattern. The 14-day SMA indicator is underneath the 50-day SMA indicator. The Stochastic Oscillators are pointing toward the northbound direction closer to the range of 80. That indicates the current trading situation suggests that upward momentum is ongoing against a resistance line as writing.
Note:Forexschoolonline.com is not a financial advisor. Do your research before investing your funds in any financial asset or presented product or event. We are not responsible for your investing results.
Learn to Trade Forex Online
GBP/USD Price Declines Past 1.3200
Footer

ForexSchoolOnline.com helps individual traders learn how to trade the Forex market
WARNING: The content on this site should not be considered investment advice and we are not authorised to provide investment advice. Nothing on this website is an endorsement or recommendation of a particular trading strategy or investment decision. The information on this website is general in nature so you must consider the information in light of your objectives, financial situation and needs.
Investing is speculative. When investing your capital is at risk. This site is not intended for use in jurisdictions in which the trading or investments described are prohibited and should only be used by such persons and in such ways as are legally permitted. Your investment may not qualify for investor protection in your country or state of residence, so please conduct your own due diligence or obtain advice where necessary. This website is free for you to use but we may receive a commission from the companies we feature on this site.
We Introduce people to the world of currency trading. and provide educational content to help them learn how to become profitable traders. we're also a community of traders that support each other on our daily trading journey
Forexschoolonline.com is not a financial advisor. Do your research before investing your funds in any financial asset or presented product or event. We are not responsible for your investing results.
Leave a Reply