British Pound Price Prediction – July 27
The GBP/USD market swings from a lower trading point to trade around the level at 0.3787. As of writing, the currency pair witnesses a smaller negative percentage rate of about 0.23.
GBP/USD Market
Key Levels:
Resistance levels: 1.3900, 1.4000, 1.4100
Support levels: 1.3700, 1.3600, 1.3500
GBP/USD – Daily Chart
The GBP/USD daily chart reveals that the currency pair market swings in bearish channel trends to hit resistance around the upper channel trend-line. The upper bearish channel trend-line drew alongside the 14-day SMA indicator, facing southward below the 50-day SMA indicator. The Stochastic Oscillators are placed at range 80, nearing the overbought region. The base coin will soon lose momentum to the counter currency.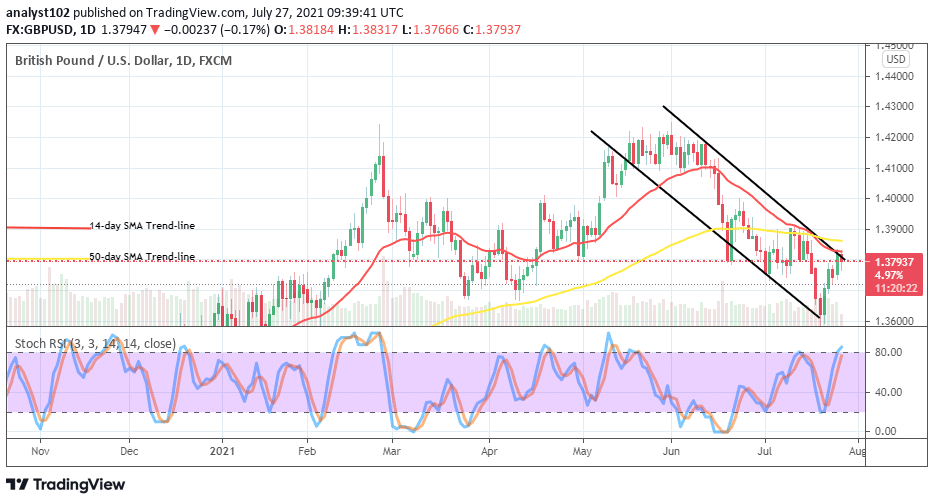 How soon will there be a downward motion as the GBP/USD market swings northward?
There will be a downward motion in the currency pair while price-action emerges around the level of 1.3800 as the market swings around it. A forceful breakout at the point earlier mentioned appears not releasable in the near trading operations. Therefore, bulls needed to wait for a pull-down to occur around that value to touch the previous lower value at 1.3600 or a bit southward push past the point to consider launching a buy order.
On the downside of technical trading analysis, as it is, the points around 1.3800 and 1.3900 are potentially where the GBP/USD market bears should be on the lookout to consider, launching of a sell order especially, when price action occurs to face rejection to the upside. Therefore, traders needed to exercise trading principles in line with proper money management after placing a position.
In summary, there may still be an extension of the currency pair into the points between 1.3800 and 1.3900 only to probably allow the GBP/USD market bears to find an entry for a sell order. The market swinging further past those points could in no time lead to the bulls’ trap.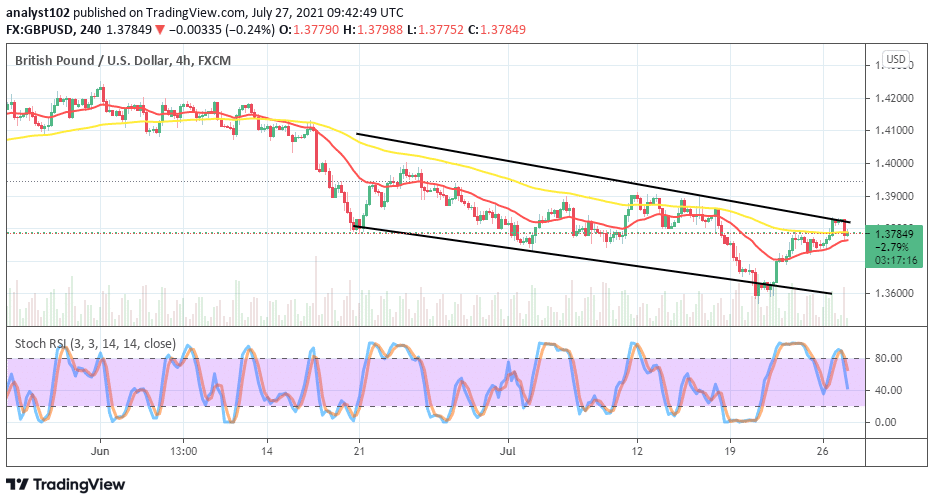 GBP/USD 4-hour Chart
Definite bearish channel trend lines are shown on the GBP/USD medium-term chart as the market swings northward to touch the upper bearish channel trend-line. The SMA trend lines are in the bearish channel trend lines as the 50-day SMA indicator is over the 14-day SMA trend-line. The Stochastic Oscillators have crossed the lines southbound from the overbought region close to the range at 40. That indicates that a downward is getting prepared on a higher note to take the market’s control from that trading situation.
Note: Forexschoolonline.com is not a financial advisor. Do your research before investing your funds in any financial asset or presented product or event. We are not responsible for your investing results.
Learn to Trade Forex Online
GBP/USD Market Swings to Hit Resistance
Footer

ForexSchoolOnline.com helps individual traders learn how to trade the Forex market
WARNING: The content on this site should not be considered investment advice and we are not authorised to provide investment advice. Nothing on this website is an endorsement or recommendation of a particular trading strategy or investment decision. The information on this website is general in nature so you must consider the information in light of your objectives, financial situation and needs.
Investing is speculative. When investing your capital is at risk. This site is not intended for use in jurisdictions in which the trading or investments described are prohibited and should only be used by such persons and in such ways as are legally permitted. Your investment may not qualify for investor protection in your country or state of residence, so please conduct your own due diligence or obtain advice where necessary. This website is free for you to use but we may receive a commission from the companies we feature on this site.
We Introduce people to the world of currency trading. and provide educational content to help them learn how to become profitable traders. we're also a community of traders that support each other on our daily trading journey
Forexschoolonline.com is not a financial advisor. Do your research before investing your funds in any financial asset or presented product or event. We are not responsible for your investing results.
Leave a Reply