GBP/USD Price Prediction – November 15
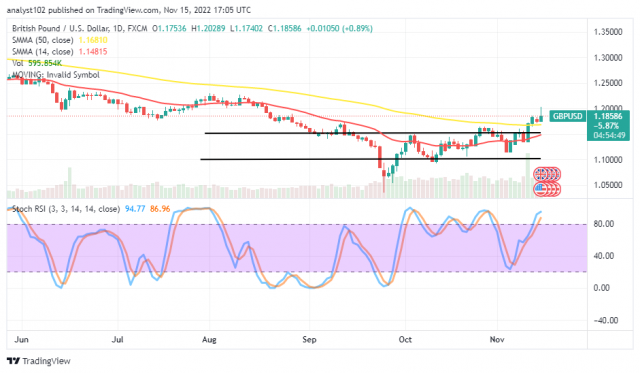
As there has been a sign of weaknesses in the GBP/USD market bears, pushing the pace for quite a while, the pairing fiat coin market currently surges higher past the SMA points. The trading zones have shifted to higher lines between 1.17402 and 1.20289, keeping a minute percentage rate of 0.89 positives.
GBP/USD Market
Key Levels:
Resistance levels: 1.2000, 1.2100, 1.2200
Support levels: 1.1500, 1.1400, 1.1300
GBP/USD – Daily Chart
The GBP/USD daily chart reveals that the currency pair market surges higher past SMA points. The 14-day SMA indicator is at 1.14815, underneath the 1.16810 value line of the 50-day SMA indicator. The upper horizontal line drew at the 1.1500 support level, making the line price likely to fall back into previous range-bound zones. The Stochastic Oscillators have penetrated the overbought region, maintaining 86.96 and 94.77 levels in the upside direction.
Will there be more uprisings beyond the 1.2000 resistance level in the GBP/USD market?
Currently, the market is experiencing some loss of points, having touched the 1.2000 resistance level during today’s ongoing session as the price surges higher past SMA points. The value line of the 50-day SMA at 1.16810 will serve as the first pivotal support line that buyers heed not to let the market reverses to maintain pushes to the upside.
On the downside of the technical analysis, as the price hit resistance around the 1.2000 line, it shows an overhead barrier will build soon around or below the trading point mentioned. A decent selling order position will achieve if the price tends to have several rejection signs around the value line.
Finally, as the GBP/USD market reaches resistance near 1.2000, bears may seize control of the following sessions. Bulls should be cautious about executing new orders, even if the price action appears to be moving up more.
GBP/USD 4-hour Chart
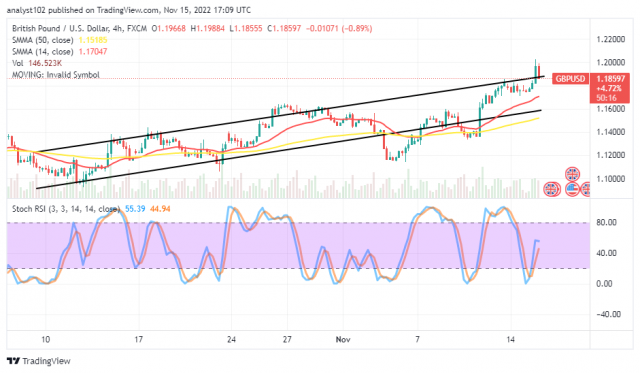
The GBP/USD medium-term chart reveals that the currency pair market surges higher past the SMAs to the extent of tempting to break the upper bullish trend line. The 14-day SMA indicator is at 1.17047 above the 1.15185 value line of the 50-day SMA indicator. The Stochastic Oscillators are around 55.39 and 44.94 levels, signifying the possibility of crossing back southbound. That suggests that sellers are somewhat returning to a course of action to prevail in the market.
Note: Forexschoolonline.com is not a financial advisor. Do your research before investing your funds in any financial asset or presented product or event. We are not responsible for your investing results.
Learn to Trade Forex Online
GBP/USD Market Surges Higher Past SMA Points
Footer

ForexSchoolOnline.com helps individual traders learn how to trade the Forex market
WARNING: The content on this site should not be considered investment advice and we are not authorised to provide investment advice. Nothing on this website is an endorsement or recommendation of a particular trading strategy or investment decision. The information on this website is general in nature so you must consider the information in light of your objectives, financial situation and needs.
Investing is speculative. When investing your capital is at risk. This site is not intended for use in jurisdictions in which the trading or investments described are prohibited and should only be used by such persons and in such ways as are legally permitted. Your investment may not qualify for investor protection in your country or state of residence, so please conduct your own due diligence or obtain advice where necessary. This website is free for you to use but we may receive a commission from the companies we feature on this site.
We Introduce people to the world of currency trading. and provide educational content to help them learn how to become profitable traders. we're also a community of traders that support each other on our daily trading journey
Forexschoolonline.com is not a financial advisor. Do your research before investing your funds in any financial asset or presented product or event. We are not responsible for your investing results.

Leave a Reply