British Pound Price Prediction – October 26
The GBP/USD market operation holds at 1.3800 for about a couple of days’ trading sessions. The currency pair worth trades around 1.3792 as of writing at a percentage rate of about 0.20 positive. It means there is still an indication that the market momentum to the upsides is intact.
GBP/USD Market
Key Levels:
Resistance levels: 1.3900, 1.4000, 1.4100
Support levels: 1.3700, 1.3600, 1.3500
GBP/USD – Daily Chart
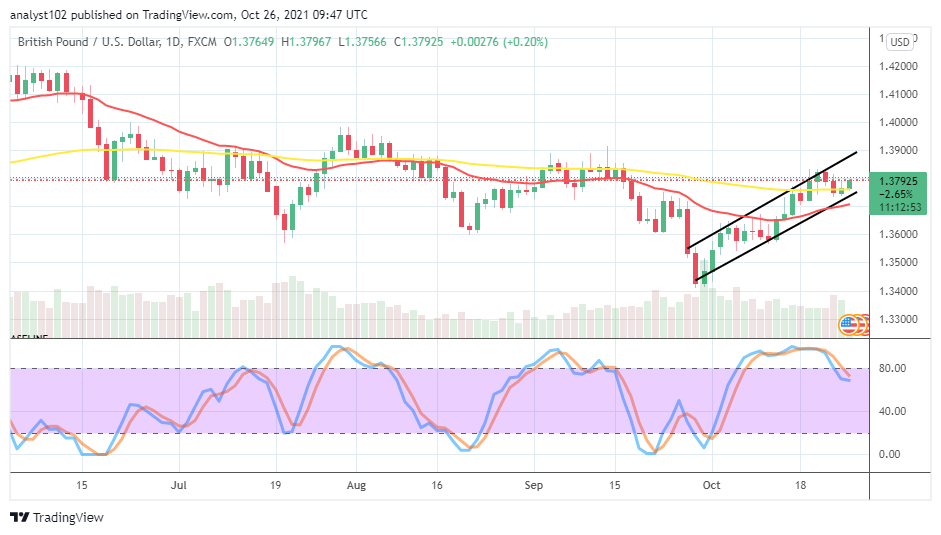
The GBP/USD daily chart reveals that the currency pair market operation holds at 1.38000 as there have been notable downs and ups around the trading line. The bullish channel trend lines drew slightly across the SMAs to exhibit the paths within, which the market keeps in its recently embarked journey to the north side. The 14-day SMA indicator is yet to touch the 50-day SMA indicator from below. The Stochastic Oscillators have briefly bent southbound against the range 80, trying to close the lines around range 70. That indicates that the currency pair trade may experience a pause in the business activity soon. How long will the GBP/USD price experience a pause in its business activities as the market operation holds at 1.3800l?
It seems uneasy by now to project how long will the GBP/USD price experience a pause in its business activities as the market operation holds at 1.3800 over a couple of sessions until the present. In the meantime, it would be necessary that the market moves down in a retracement process toward around 1.3700. A rebound is to occur after a while so that a buy entry can be.
On the downside of technical analysis, the GBP/USD market bears may have to watch for a retest of the 1.3900 resistance level giving back a forceful reversal motion before considering joining the trade. While in the scenario of having that price pushes slowly to the north further away from that value line, traders would need to be cautious of exerting any position for a while.
Summarily, Price action needed to be awaited by traders to determine the exact time to launch an entry order in the GBP/USD market operation as price holds around 1.3800. The market level at 1.3700 appears to be the critical support baseline that bulls will have to be wary of in their northward continuation moving bid. GBP/USD 4-hour Chart
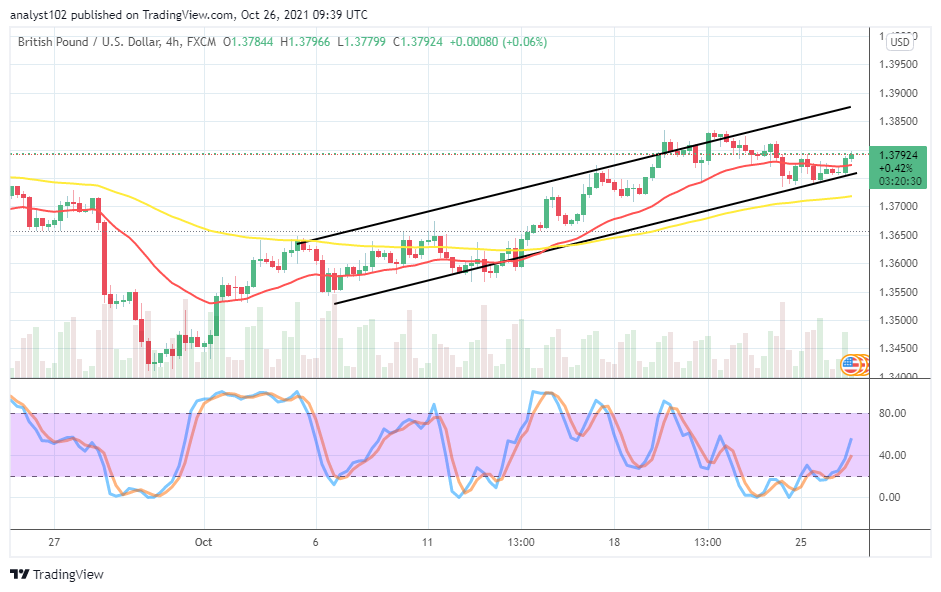
The GBP/USD medium-term chart reveals that the currency pair market operation holds at 1.3800 closer to the lower bullish channel trend line. The 14-day SMA indicator is above the 50-day SMA indicator. And, the smaller indicator has slightly breached northward. The Stochastic Oscillators are briefly pointing northbound against the range of 40. That suggests that the base coin is striving to push the counter price momentum.
Note: Forexschoolonline.com is not a financial advisor. Do your research before investing your funds in any financial asset or presented product or event. We are not responsible for your investing results.
Learn to Trade Forex Online
GBP/USD Market Operation Holds at 1.3800
Footer

ForexSchoolOnline.com helps individual traders learn how to trade the Forex market
WARNING: The content on this site should not be considered investment advice and we are not authorised to provide investment advice. Nothing on this website is an endorsement or recommendation of a particular trading strategy or investment decision. The information on this website is general in nature so you must consider the information in light of your objectives, financial situation and needs.
Investing is speculative. When investing your capital is at risk. This site is not intended for use in jurisdictions in which the trading or investments described are prohibited and should only be used by such persons and in such ways as are legally permitted. Your investment may not qualify for investor protection in your country or state of residence, so please conduct your own due diligence or obtain advice where necessary. This website is free for you to use but we may receive a commission from the companies we feature on this site.
We Introduce people to the world of currency trading. and provide educational content to help them learn how to become profitable traders. we're also a community of traders that support each other on our daily trading journey
Forexschoolonline.com is not a financial advisor. Do your research before investing your funds in any financial asset or presented product or event. We are not responsible for your investing results.

Leave a Reply