GBP/USD Price Prediction – September 7
The GBP/USD business activity fluctuates while the currency pair’s price has been able to push northward a bit away from the bearish pathways it followed recently. The crypto’s financial book of records sees a smaller positive percentage rate of about 0.07 as price trades around 1.3838 level as of writing.
GBP/USD Market
Key Levels:
Resistance levels: 1.3900, 1.4000, 1.4100
Support levels: 1.3700, 1.3600, 1.3500
GBP/USD – Daily Chart
The GBP/USD daily chart showcases that the currency pair’s business activity fluctuates, having been able to push slightly northward out of the bearish channel trend lines. The upper bearish channel trend line drew southward to touch the 14-day SMA indicator underneath the 50-day SMA indicator. There has been a line of candlesticks converging around the trend-line of the bigger SMA. The Stochastic Oscillators are in the overbought region with the lines closed, seemingly making an effort to bend southbound. That could be a warning signal that the pressure to swing northward more is getting reduced gradually.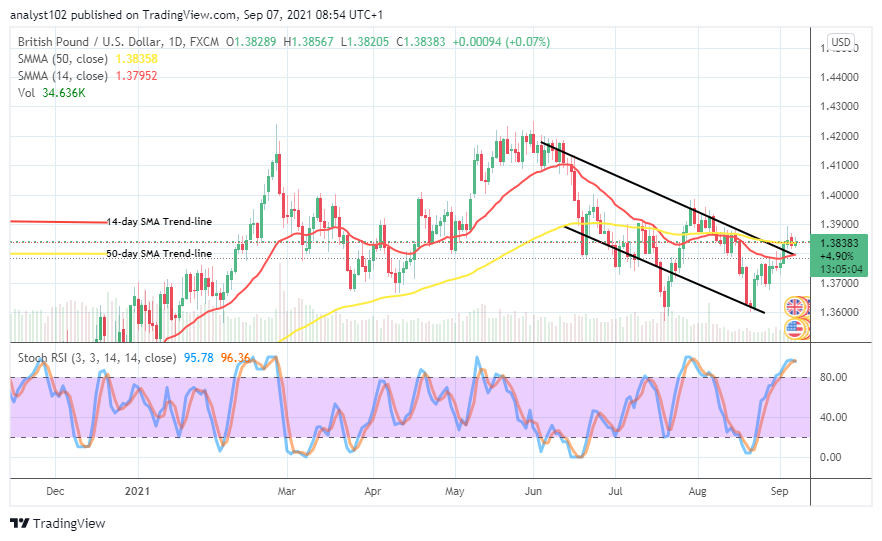 Will breaking out of the GBP/USD price at 1.3900 be worth counting upon as the currency pair’s business activity fluctuates beneath it?
The breaking out of the GBP/USD price at 1.3900 coupled with the interception of the 50-day SMA trend-line by the 14-day SMA trend-line from beneath will signal a strong stance for seeing further ups of the fiat market. Nevertheless, that scenario may take time before it can show up. A bullish candlestick formed on September 2nd, spanning to the north side from a lower line against the trend-line of the 14-day SMA around 1.3800, has prepared the paths to get possible buy entries.
On the downside, the GBP/USD market bears have to retard against any abrupt upward pressure features in an attempt to breakout past the 1.3900 resistance line. Meanwhile, the positioning of the Stochastic Oscillators in the overbought region suggests the possibility that bears tend to have a prevalence advantage over bulls’ presence in the market while active price motion occurs.
Summarily, there may be some necessary lines of downs purposely to allow the GBP/USD market bulls may find support to muster up the energy. The points around 1.3800 and 1.3700 may be the zones where candlesticks suggest rebuilding of catalyst.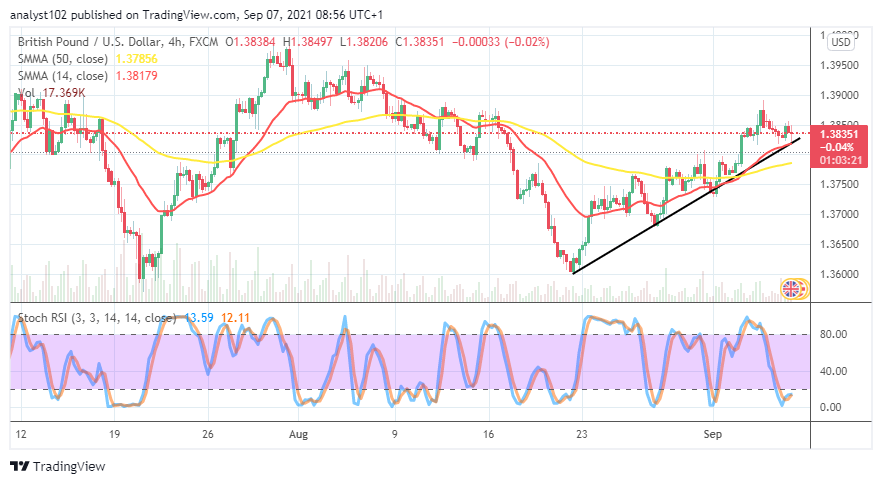 GBP/USD 4-hour Chart
The GBP/USD 4-hour chart showcases that the currency pair’s business activity fluctuates around 1.3850 over the indicators. The bullish trend-line drew alongside the 14-day SMA trend-line over the 50-day SMA indicator. The Stochastic Oscillators are in the oversold region with the closed and, a consolidation movement of the indicator in it may cause the market to go down for a while. While that plays out, a rebounding motion can also feature in no time.
Note: Forexschoolonline.com is not a financial advisor. Do your research before investing your funds in any financial asset or presented product or event. We are not responsible for your investing results.
Learn to Trade Forex Online
GBP/USD Business Activity Fluctuates, Having Pushed Northward Slightly
Footer

ForexSchoolOnline.com helps individual traders learn how to trade the Forex market
WARNING: The content on this site should not be considered investment advice and we are not authorised to provide investment advice. Nothing on this website is an endorsement or recommendation of a particular trading strategy or investment decision. The information on this website is general in nature so you must consider the information in light of your objectives, financial situation and needs.
Investing is speculative. When investing your capital is at risk. This site is not intended for use in jurisdictions in which the trading or investments described are prohibited and should only be used by such persons and in such ways as are legally permitted. Your investment may not qualify for investor protection in your country or state of residence, so please conduct your own due diligence or obtain advice where necessary. This website is free for you to use but we may receive a commission from the companies we feature on this site.
We Introduce people to the world of currency trading. and provide educational content to help them learn how to become profitable traders. we're also a community of traders that support each other on our daily trading journey
Forexschoolonline.com is not a financial advisor. Do your research before investing your funds in any financial asset or presented product or event. We are not responsible for your investing results.
Leave a Reply