EURUSD Key Zones
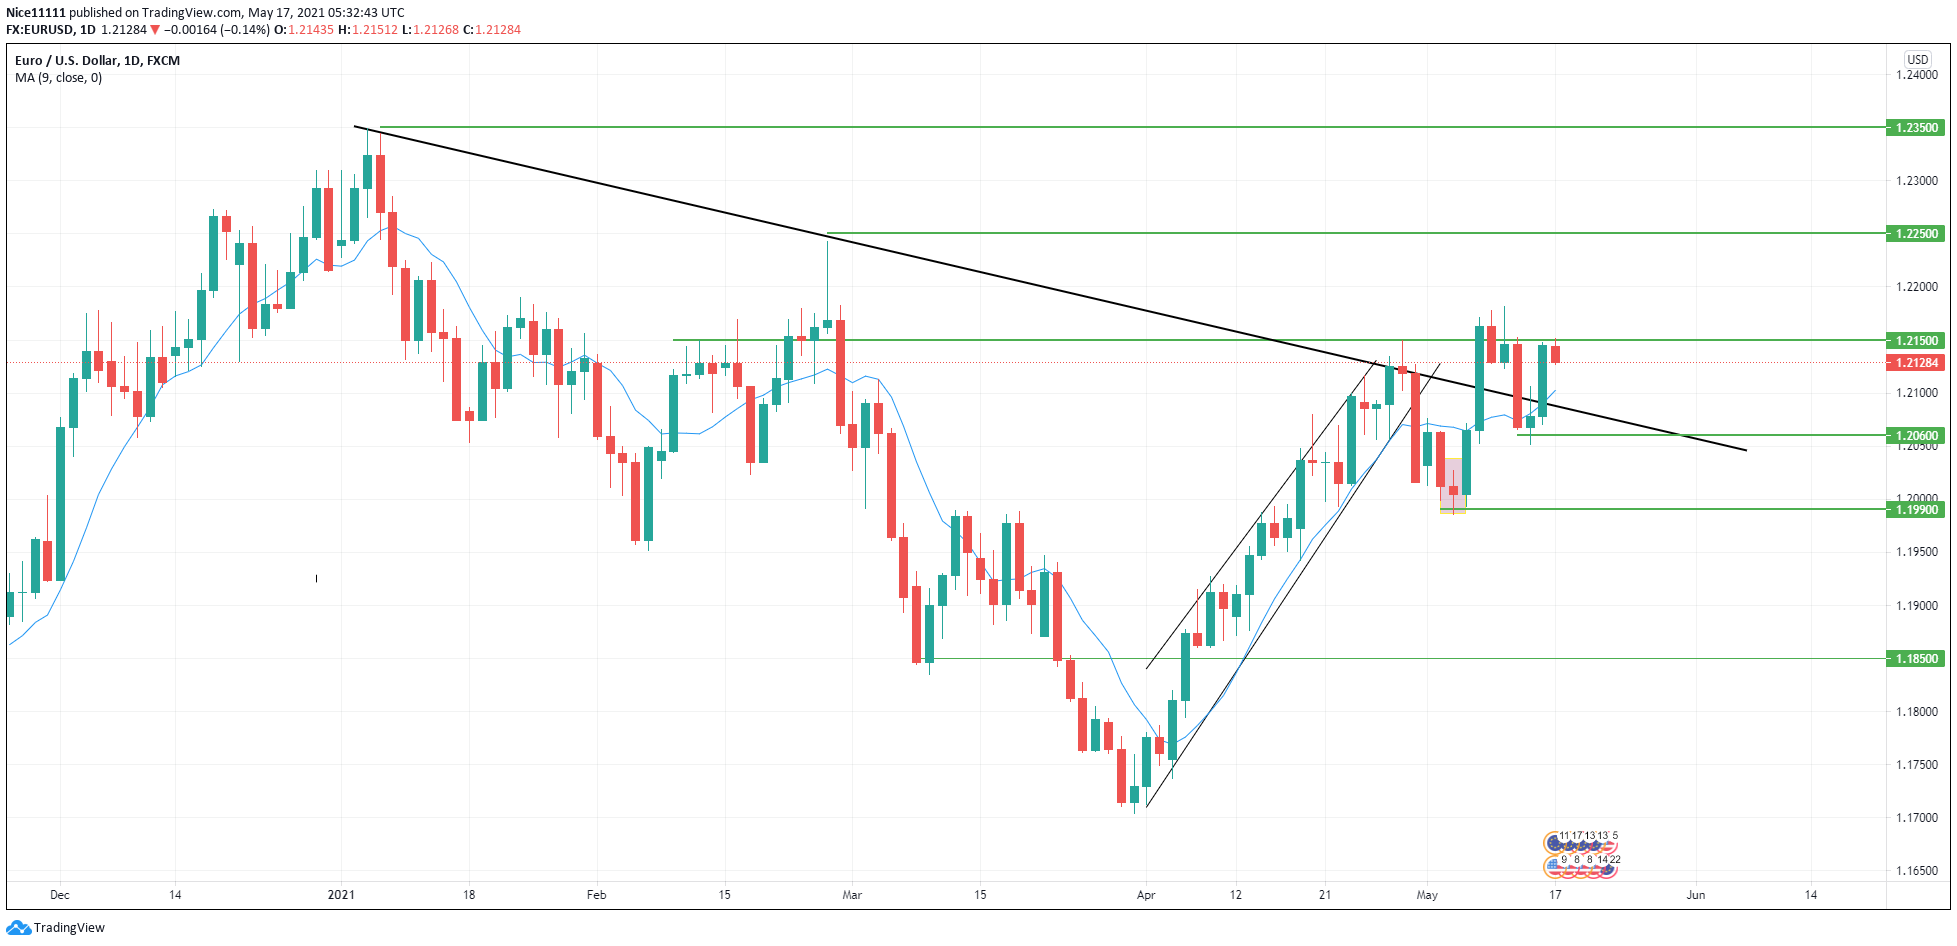
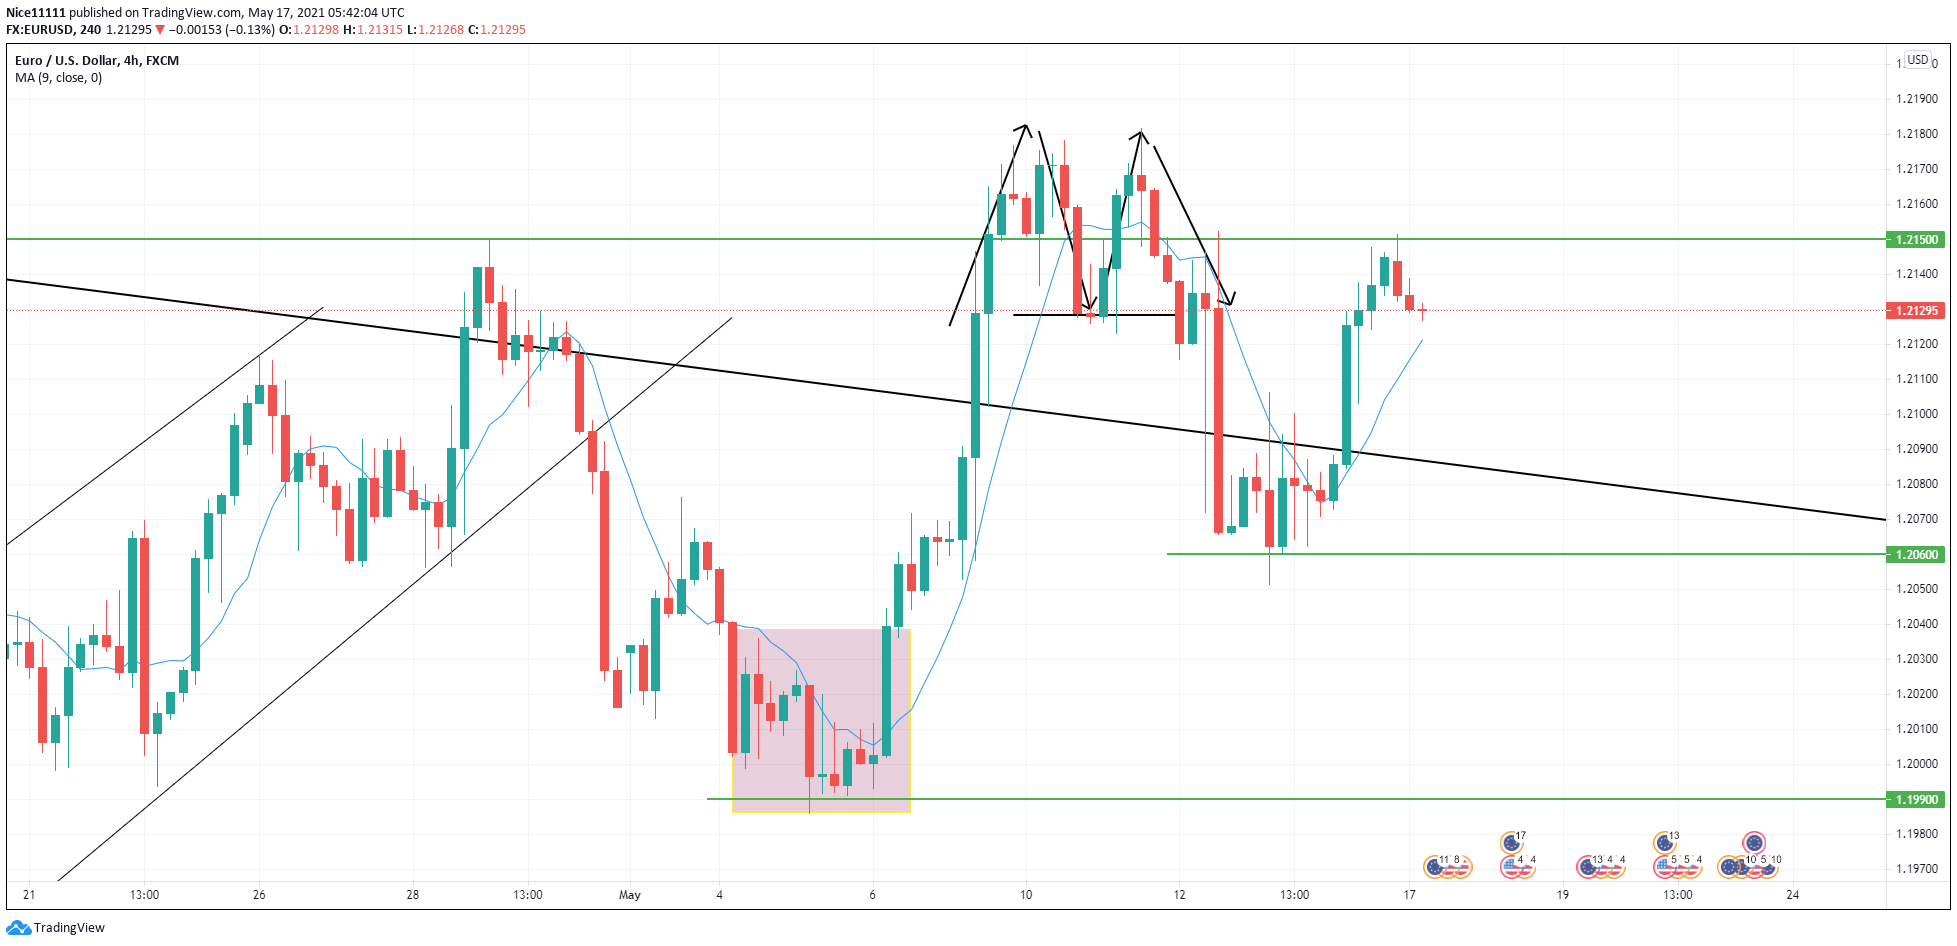
Resistance Level:1.23500, 1.22500, 1.21500
Support Level: 1.20600, 1.19900, 1.18500
EURUSD failed to break out of the descending trend line upon the third touch. It bounced lower off the bearish trend line on the 29th of April. Price drive was bearish for the next few days till it found support at 1.20000. The support at 1.20000 propelled the price to go higher. The rally upon reaching the support was strong enough to cause a breakout through the downward trend just above.

Price has shown willingness to go higher after the breakout. Price has created support at 1.20600 slightly below the trend line. After breaking the channel, the retracement back to the trend line which is the retest has shown price bullishness. Price is currently at a resistance zone at 1.21500. Price is likely to break through the zone to reach 1.22500.
The 9 SMA (Simple Moving Average) has formed support for the price to go higher. The 9 MA lies under the candles above the just above 1.20000 support level. On the 4-hour chart, a double top is seen to have formed at 1.21500 between May 7th and 12th of May. The neckline at 1.21300 is broken and the price dropped into the support level at 1.20600. As of the time of writing, the price is struggling at the 1.21500 resistance zone showing bearish candles. If the price fails to break through the resistance, the price is likely to plunge once again into the 1.20600 support zone.
Note: Forexschoolonline.com is not a financial advisor. Do your research before investing your funds in any financial asset or presented product or event. We are not responsible for your investing results.


Leave a Reply