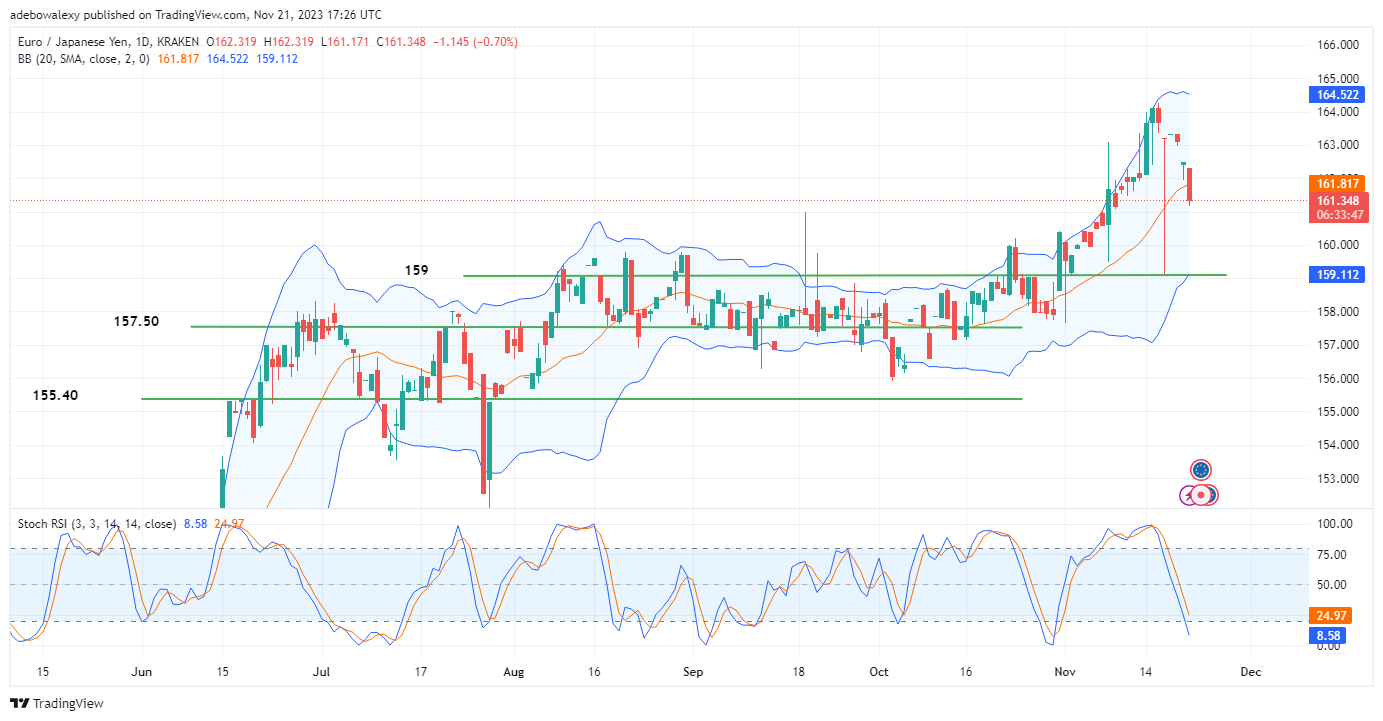
Price action in the EURJPY market has been spiraling downward after the tailwind that took its price action from below the 159.00 price mark terminated around the 164.00 mark. Today’s trading session has seen the pair tear through the middle limit of the Bollinger Bands. Let’s take a more careful look at price movements in this market.
Key Price Levels:
Resistance Levels: 162.00, 163.00, and 164.00
Support Levels: 161.34, 161.00, and 160.00

EURJPY Bears May Be Showing False Strength
Looking at the size of the price candle for the ongoing session in the EURJPY market, one can see that there has been a significant headwind in today’s trading session. Also, today’s session has seen prices fall below the middle limit of the Bollinger Bands indicator. As a result, this suggests that bearish momentum may be getting stronger in this market.
However, the Relative Strength Index (RSI) indicator lines seem hyperextended, with their lines having fallen deep into the oversold region at the 24.97 and 8.58 marks of the indicator. Consequently, this suggests that bearish momentum may abate at a nearby support above the 159.00 mark.

EURJPY Maintains Bearish Characteristics
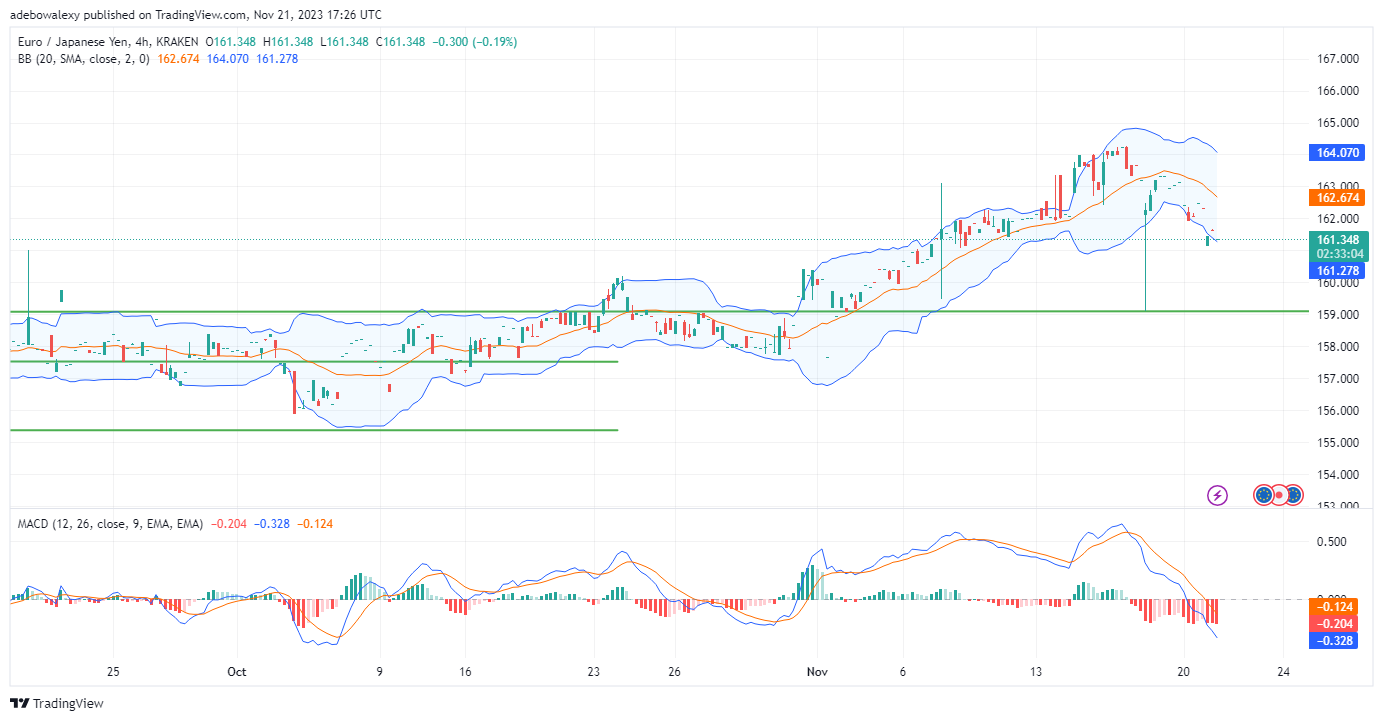
Price action in the 4-hour EURJPY can be seen hugging the lower limit of the Bollinger Bands. The ongoing session hasn’t offered any encouraging signs to long traders, as it has appeared as just a small price candle.
As a result, the pair keeps trading just above 161.35. Additionally, the Moving Average Convergence Divergence (MACD) indicator lines can be seen diving downwards, still below the equilibrium level, while their bars are solid red and continue to grow taller on the negative axis. Consequently, this signals that bears are still in charge, and price action may progress towards the 160.00 mark.
Do you want to take your trading to the next level? Join the best platform for that here.


Leave a Reply