EURCHF Analysis – May 5
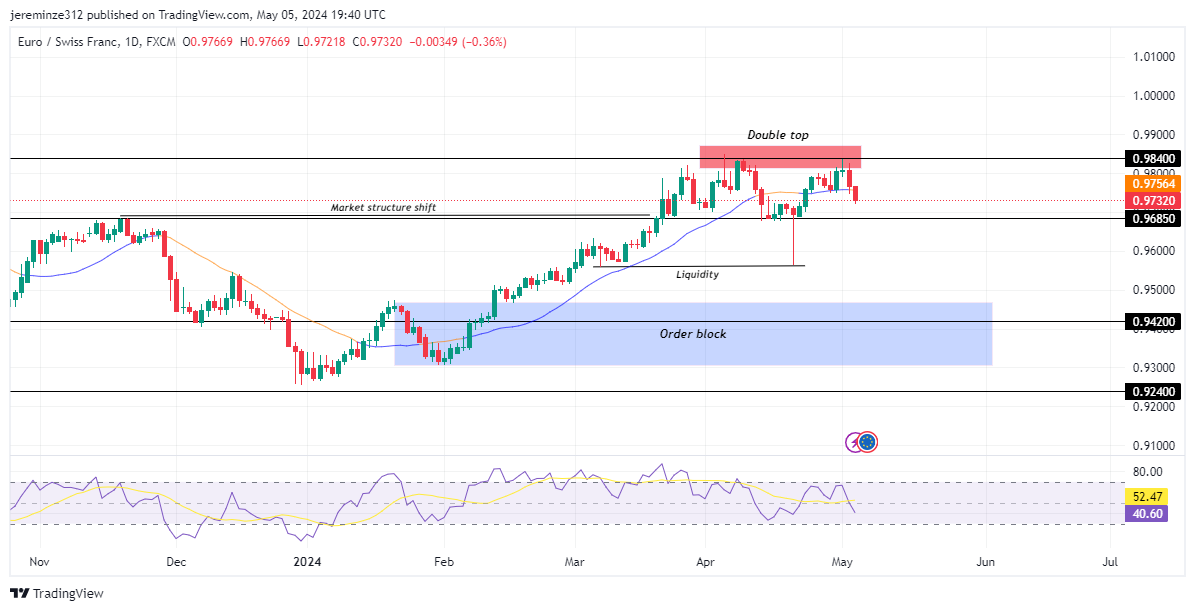
EURCHF experienced a change in trend in late May 2024, leading to a shift in general bias to bullish. However, the bullish momentum has started to decline as a double top reversal pattern is formed, with resistance seen at 0.98400.
EURCHF Significant Zones
Resistance Levels: 0.96850, 0.98400
Support Levels: 0.94200, 0.92400

EURCHF has recently undergone a significant shift in market structure on the daily time frame, transitioning from a bearish to a bullish trend. This change was primarily catalyzed by the price action breaking through a key resistance level at 0.96850. Despite this bullish momentum, the upward movement encountered resistance at the 0.98400 level, which has led to the formation of a potential double top reversal pattern, signaling a pause in the bullish advance.
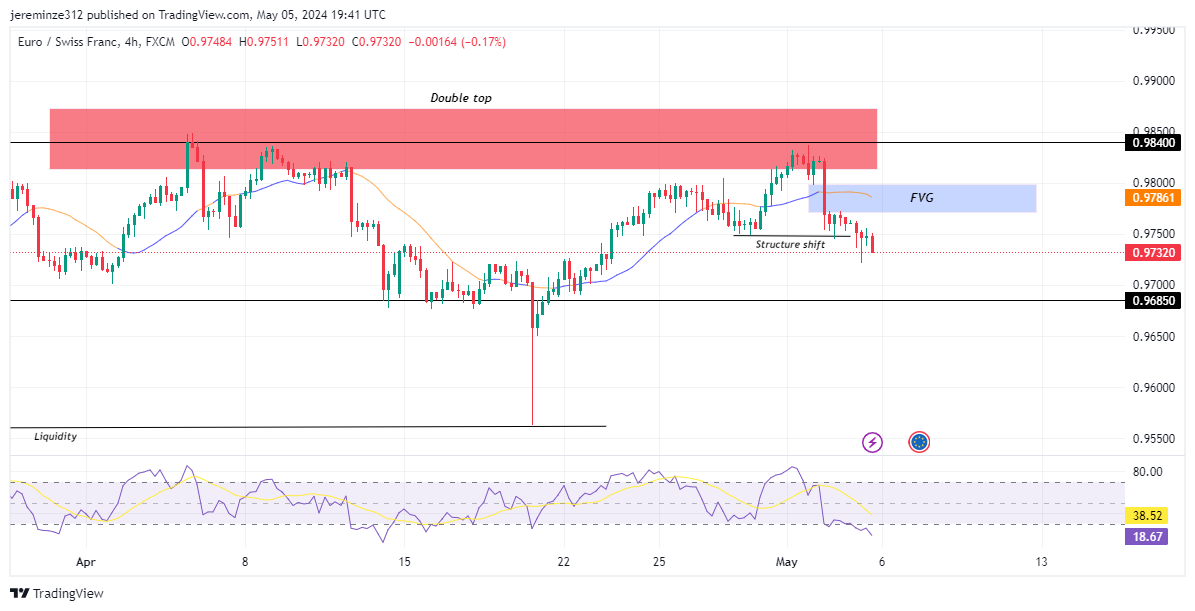
The daily Relative Strength Index (RSI) on the daily chart suggests a weakening in buying pressure, as the indicator approaches the 30.0 oversold threshold foreshadowing a near-term pullback in price. Moreover The 4-hours Moving Averages (MAs) reflects the transition from bearish to bullish conditions. Nevertheless, as the price begins to recede below the Moving Average lines, the signal strength is diminishing, hinting at a possible slowdown or reversal in trend.

Market Expectation
EURCHF price action is on the lookout below the 0.96850 level, as a drop below this could trigger stops and take out liquidity positioned beneath it. Subsequently, the price is expected to trigger the order block and act as a springboard for the price, potentially propelling it back above both the 0.96850 and the 0.98400 resistance levels.
Note: Forexschoolonline.com is not a financial advisor. Do your research before investing your funds in any financial asset or presented product or event. We are not responsible for your investing results


Leave a Reply