Last week, price action in the EUR/JPY market attempted to break the 143.00 price mark. However, the attempt soon failed. This week’s trading activities began with price action launching another attempt at this price mark. Let’s examine this market to see how things will go.
Major Price Levels:
Top Levels: 142.23, 142.60, 143.00
Floor Levels: 142.00, 141.65, 141.30

EUR/JPY Price Eying the 143.00 Price Mark
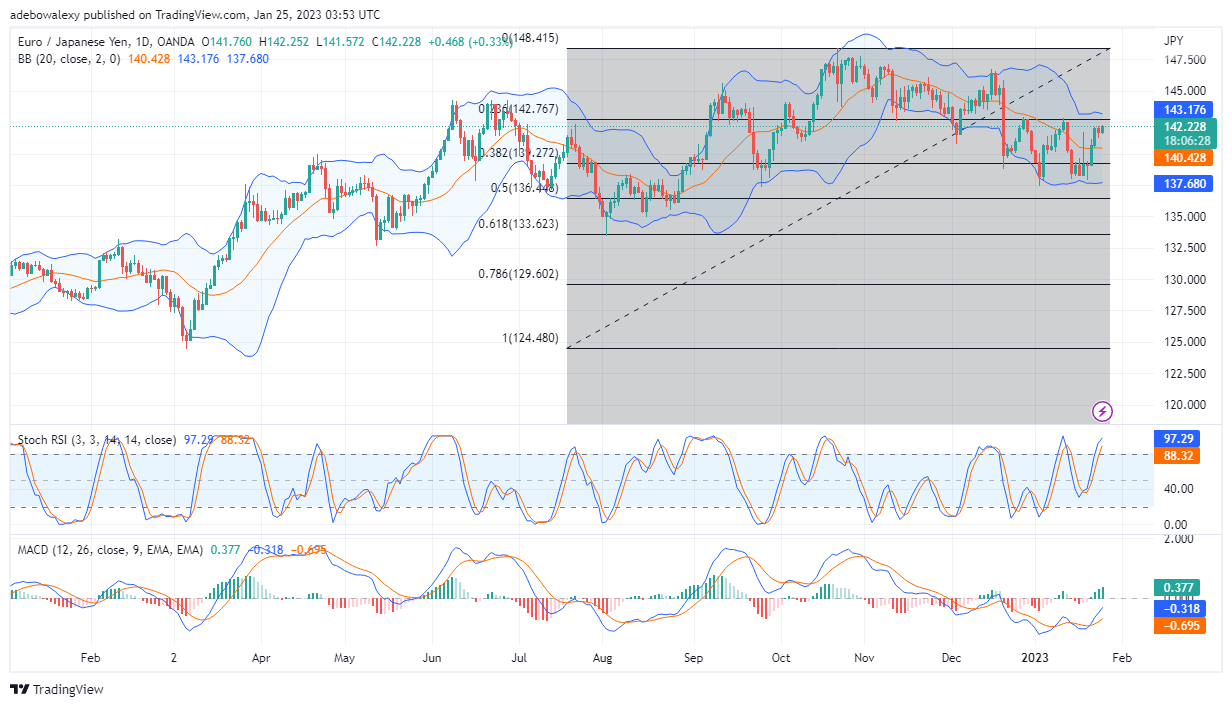
EUR/JPY is once again challenging the price mark of 143.00. The most recent price candles on this chart indicated that the bulls had just taken control away from the bears. This is because a green price candlestick has just appeared following a red one. Also, price activities are occurring above the middle limit of the Bollinger indicator, and this hints at a continued upside movement of price. The RSI lines are now overbought, while the MACD keeps revealing that upside momentum is building. Consequently, the signs from the technical indicators here suggest that the price may keep moving upward.

The EUR/JPY Price Upside Move Seems to Be Getting Stronger
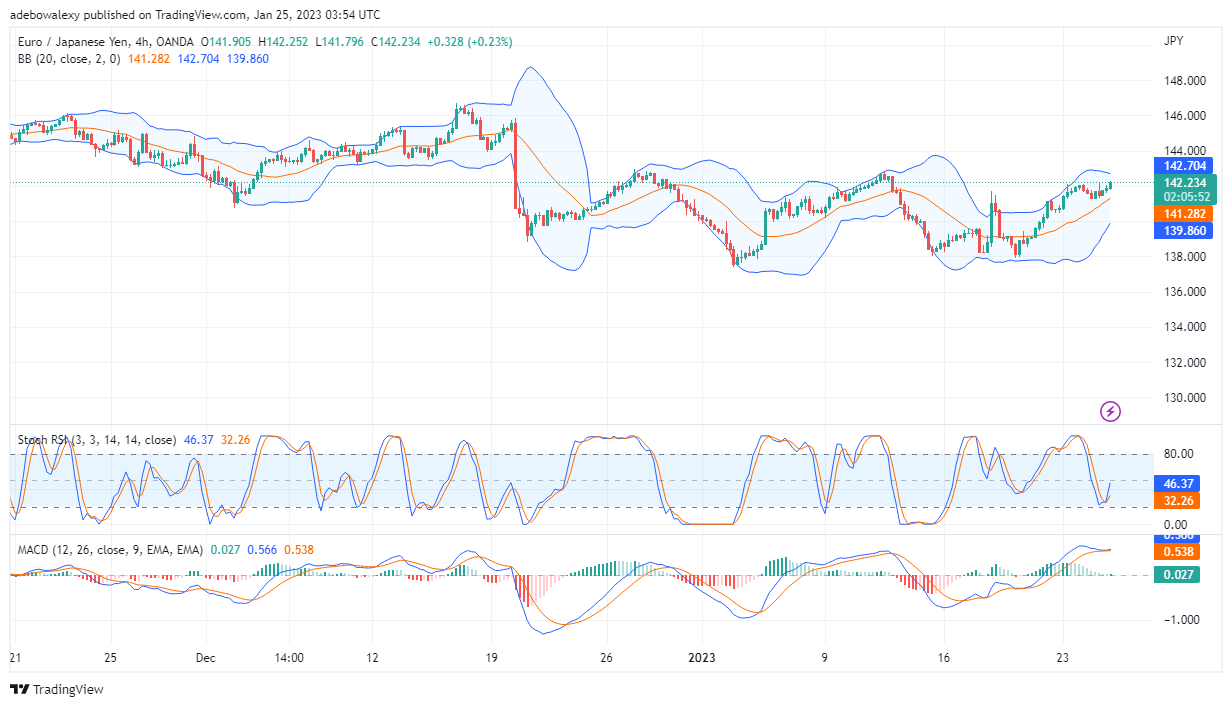
In the 4-hour market, it appears as if the observed upside price movement may grow stronger. Here, price action continues to occur above the middle limit of the Bollinger Bands indicator. Also, at this point, the Stochastic RSI indicator has just given a bullish crossover in the overbought region. Furthermore, the MACD indicator seems to have regained its upside path, and a green histogram bar has just appeared to indicate a buildup in upside momentum. With all the applied trading indicators aligning to predict a continued price increase, traders can prepare to catch the trend and profit from it, as price increases towards 143.00.
Do you want to take your trading to the next level? Join the best platform for that here.


Leave a Reply