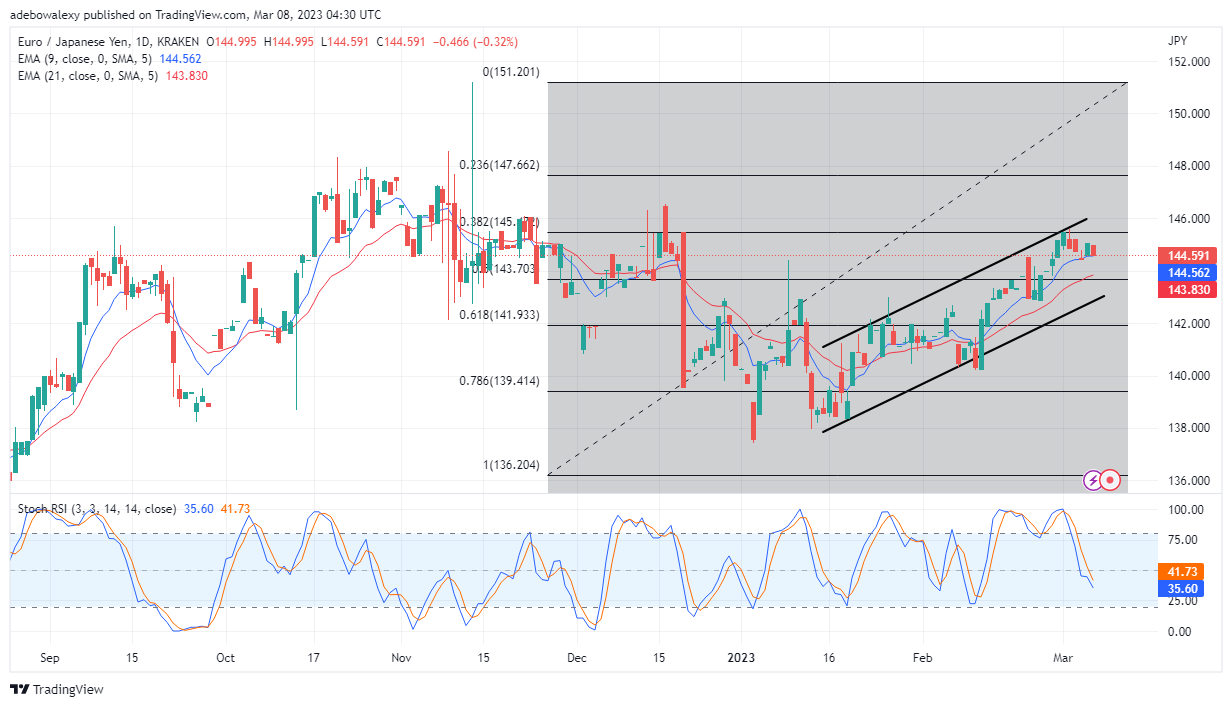
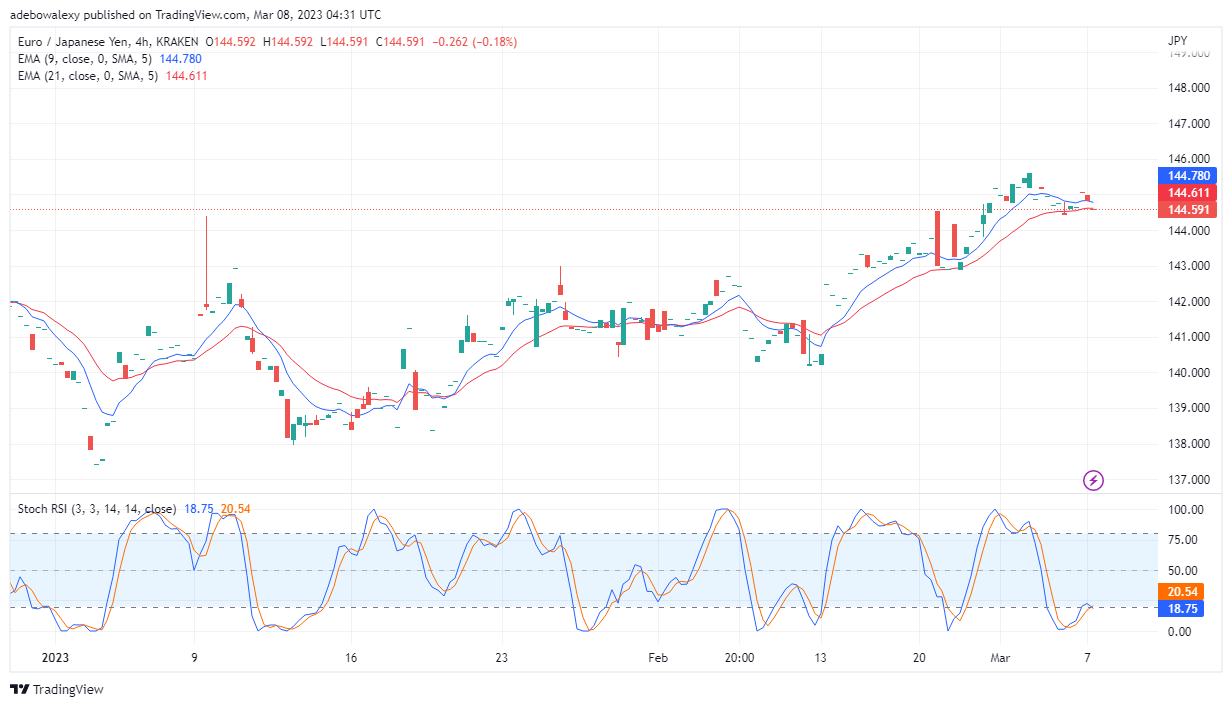
During last week, the EUR/JPY market behaved as expected, rising towards the 146.00 price mark. However, no sooner than it tested the 145.17 level, traders started going shot on the pair. Subsequently, this caused the pair’s price action to turn bearish. Nevertheless, price action appears to have reached strong support. Let’s see if it will hold or not.
Major Price Levels:
Top Levels: 145.10, 146.30, and 147.00
Floor Levels: 144.60, 142.50, and 140.20

EUR/JPY Price Action Perches on an Important Support Level
Price action on the daily EUR/JPY market has landed on very important support. What happens at this point may be a deciding factor in whether the price will proceed towards the 146.00 mark or fall to lower support levels. The last red candle here now sits on the 9-day EMA line. Meanwhile, the RSI indicator curves have resumed their downside path, falling deeper into the oversold region. Nevertheless, it is important to note that price action remains in the upside-sloping price channel. And if price action is able to remain above the EMA line, perhaps price movements will stay on tbe upside slopping path.

EUR/JPY Price Action May Grow More Bearish
Moving to the four-hour EUR/JPY market, it appears that price action has fallen below the two EMA curves in this time frame. This could be seen as a dashed-shaped red price candle that appeared just below the 21-day EMA lines. Likewise, the Stochastic RSI indicator has delivered a crossover on its way up. Subsequently, this has caused its line to turn sideways somewhere around the 19.50 mark. From the indicators here, it is expected that price action will trend downwards on this mark. Therefore, traders can expect the pair’s price to fall to around 143.60.
Do you want to take your trading to the next level? Join the best platform for that here.


Leave a Reply